AFM Fund Profile — Equitable Investors Dragonfly Fund


- Fund & Manager Details
- Investment Details
- Performance & Risk
- Advanced Analytics
- Research & Availability
- News & Insights
- Documents
Fund & Manager Details
Key Facts
| Fund Type: | Single | Discretionary/Quantitative: | Discretionary |
| Strategy: | Equity Long | This Funds FUM (millions): | |
| Style: | Blend | Fund Inception Date: | Since 01 September 2017 |
| Geographic Mandate: | Australia | Latest Return Date: | May 2026 |
| Fund Domicile: | Australia | Investor Type: | Wholesale |
| Status: | Open | Reporting Status: | Current |
Manager Details and Fund Description
| Manager: | Equitable Investors | Total FUM for all funds: | |
|
Manager Overview:
Equitable Investors was established in 2016 as a boutique funds management business that is highly aligned with its investment clientele. Equitable Investors is focused on delivering total returns to investors without regard to sharemarket indices.
Equitable Investors' investment process is based on fundamental, bottom-up analysis and ongoing, constructive dialogue with the companies in which it invests, with a view to engaging with companies and assisting them where it can in maximising shareholder value. |
Fund/Strategy Overview:
The Equitable Investors Dragonfly Fund aims to deliver a total return greater than the annual five year government bond rate + 5% pa over the medium-to-long term.
The Fund is an open ended, unlisted unit trust investing predominantly in ASX listed companies. Hybrid, debt & unlisted investments are also considered. The Fund is focused on investing in growing or strategic businesses and generating returns that, to the extent possible, are less dependent on the direction of the broader sharemarket. The Fund may at times change its cash weighting or utilise exchange traded products to manage market risk. Investments will primarily be made in micro-to-mid cap companies listed on the ASX. Larger listed businesses will also be considered for investment but are not expected to meet the manager's investment criteria as regularly as smaller peers. |
||
Investment Details
Investment Terms
| Minimum Investment: | Minimum Additional Investment: | Minimum Term: | Investment Frequency: |
| AU$20,000 | AU$20,000 | Monthly | |
| Regular Savings Option: | Regular Savings Min. Amount: |
Regular Savings Max. Amount: |
Regular Savings Freq.: |
| No | N/A | ||
| Redemption Notice: | Redemption Frequency: | Notes: | |
| Monthly |
|||
| Distributions: | Distribution Frequency: | Last Distribution Date: | Last Distribution Amount: |
| Yes | Annually | AU$ |
Structure
| Offshore/Onshore: | Fund Structure: | Share Classes: |
Trustee/Responsible Entity: |
| Onshore | Unit Trust | AU$ | Equitable Investors Pty Ltd |
| Administrator: | Prime Broker: | Custodian: | Legal: |
| William Buck Managed Funds Administration (SA) Pty Ltd | N/A | Sandhurst Trustees | Holley Nethercote Commercial and Financial Services Lawyers |
Fund Fees
| Management Fee: |
Performance Fee: |
High Water Mark: |
Hurdle: |
| 1.5% | 20% | Yes | 5 Year Australian Government Bond Yield + 5% pa |
| Buy Spread: | Sell spread: | Early Redemption Fee: | Fees Notes: |
| 0.300% | 0.300% | No | HWM set as highest closing unit price f... |
Performance & Risk
Returns
| Latest Return Date: | Latest Result: | Fund Inception Date: | Annualised Return: |
| May 2026 | -3.33% | 01 September 2017 | -8.21% |
| Latest 3 Months: | Latest 6 Months: | Latest 12 Months: | Latest 2 Years p.a.: |
| -10.17% | -21.70% | -5.95% | -7.88% |
| Latest 3 Years p.a.: |
Latest 4 Years p.a.: |
Latest 5 Years p.a.: |
Latest 7 Years p.a.: |
| -3.39% | -14.06% | -15.23% | -8.30% |
Performance Statistics
| % Positive Months (S.I.): |
Average Return: | Average +ve Return: | Average -ve Return: |
| 46.67% | -0.52% | 4.13% | -4.58% |
| Best Month: | Worst Month: | Up Capture Ratio (S.I.): |
Down Capture Ratio (S.I.): |
| 24.98% | -20.30% | 25.44% | 115.42% |
| Largest Drawdown (S.I.): |
Longest Drawdown (S.I.): |
Current Drawdown (%): |
Current Drawdown (Months): |
| -60.50% | 55 months | -60.47% | 55 months |
Risk
| Annualised Standard Deviation (S.I.): |
Downside Deviation (S.I.): |
Sortino Ratio (S.I.): |
- |
| 21.47% | 16.17% | -0.66 | - |
| Sharpe Ratio (12 months): |
Sharpe Ratio (3 years): |
Sharpe Ratio (5 years): |
Sharpe Ratio (S.I.): |
| -0.36 | -0.35 | -0.93 | -0.39 |
| Please note, Sharpe and Sortino ratios are calculated using the Australian Risk Free Rate | |||
Ranking, Research & Availability
Fund Quintile in its Peer Group (Equity Long - Small/Mid Cap - Australia) as at April 2026
AFM's Quintile Rankings show performance and Key Performance Indicators (KPI's) of Equitable Investors Dragonfly Fund compared to a peer group of funds with a similar strategy and geographic mandate. Each green square places a fund in one quintile (or 20%) of its peer group - five indicating that the fund is in the top (best) quintile for the corresponding KPI.
As a reference point the equivalent "quintile" performance of the peer group's underlying market index is also indicated by the red dot.
1 Year
3 Year
5 Year
7 Year
Equitable Investors Dragonfly Fund
S&P/ASX Small Ordinaries Index
External Research and Ratings: As reported by each Fund Manager.
No external fund ratings providedAvailability:As reported by each Fund Manager.
Available on Investment Platforms:
OLIVIA123
News & Insights
Performance Report: Equitable Investors Dragonfly Fund
The Equitable Investors Dragonfly Fund May activity was shaped by positive contributions from FirstWave Cloud Technology and Intelligent Monitoring Group, while De.mem and Spectur detracted from performance. Equitable remains focused on bottom-up investing amid macro volatility, noting that markets appear overly short-term and may be mispricing opportunities in microcaps.
Read more...
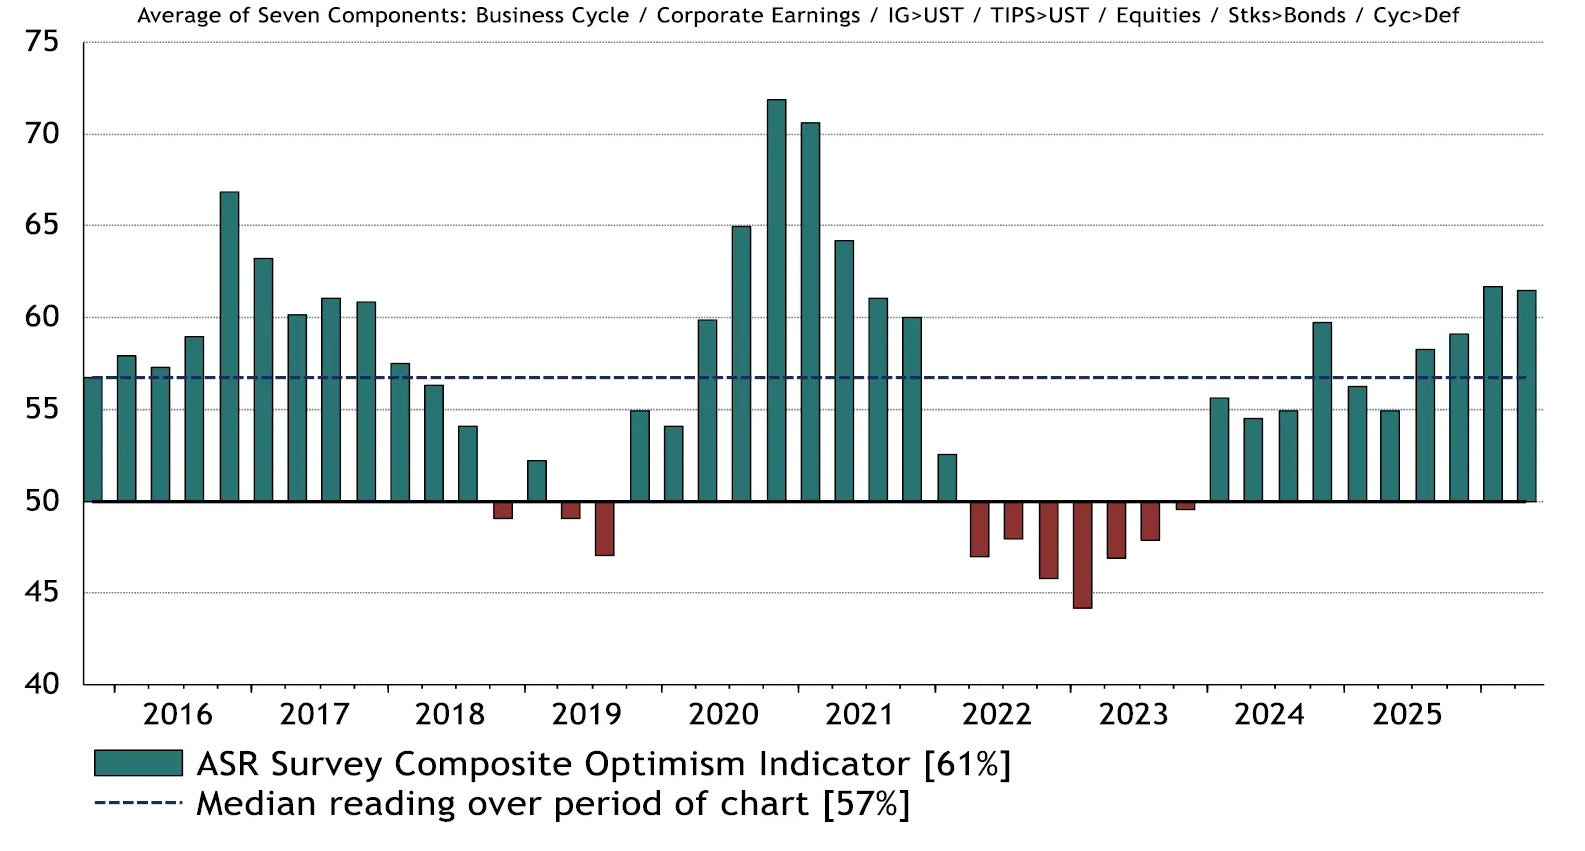
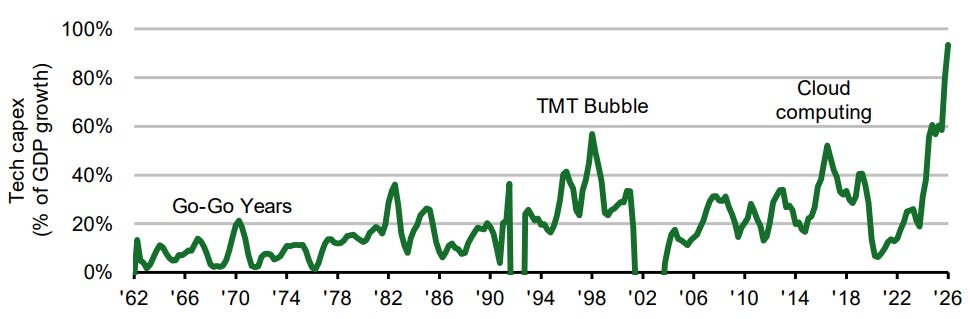
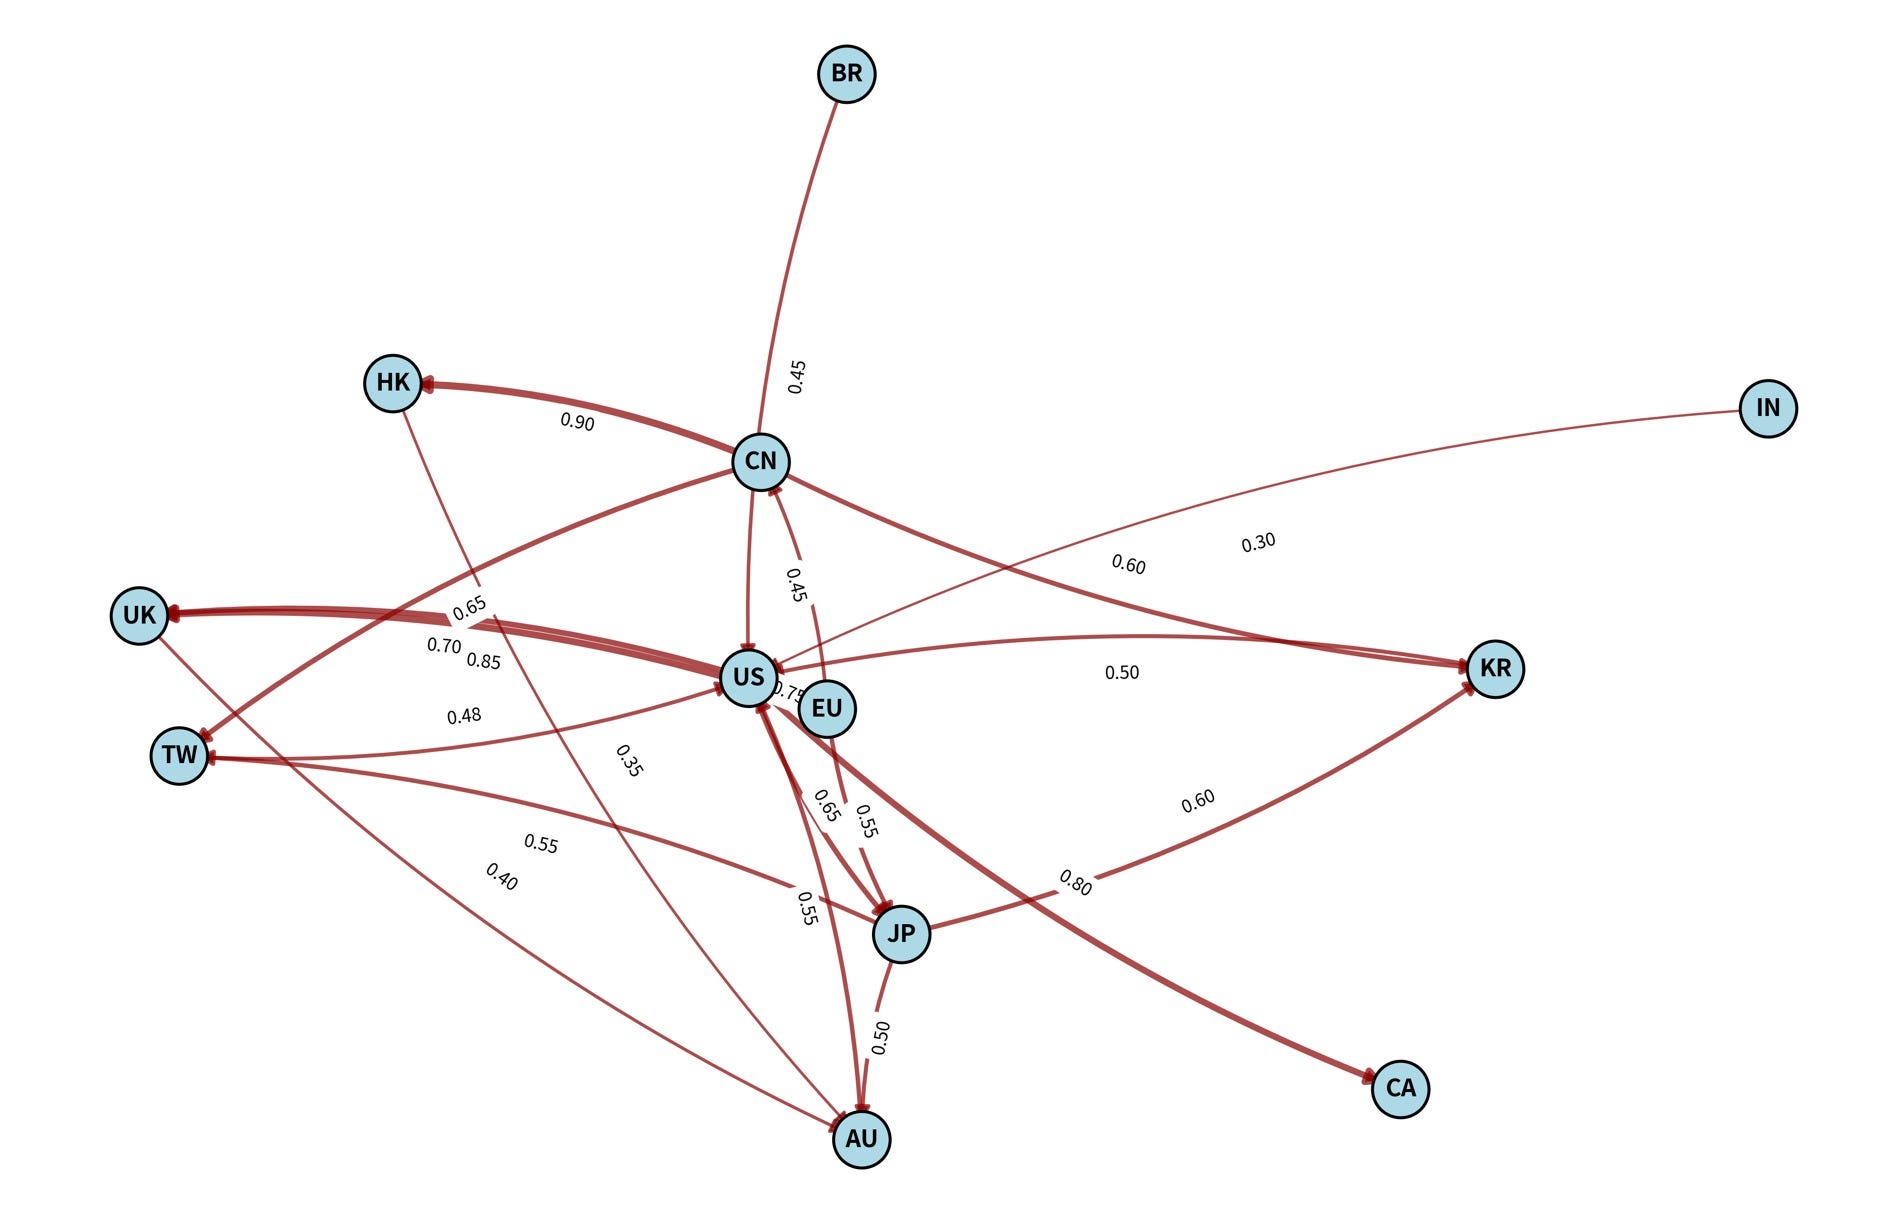
10k Words | June 2026
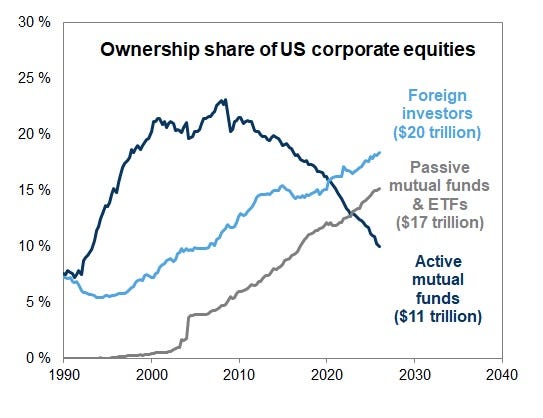
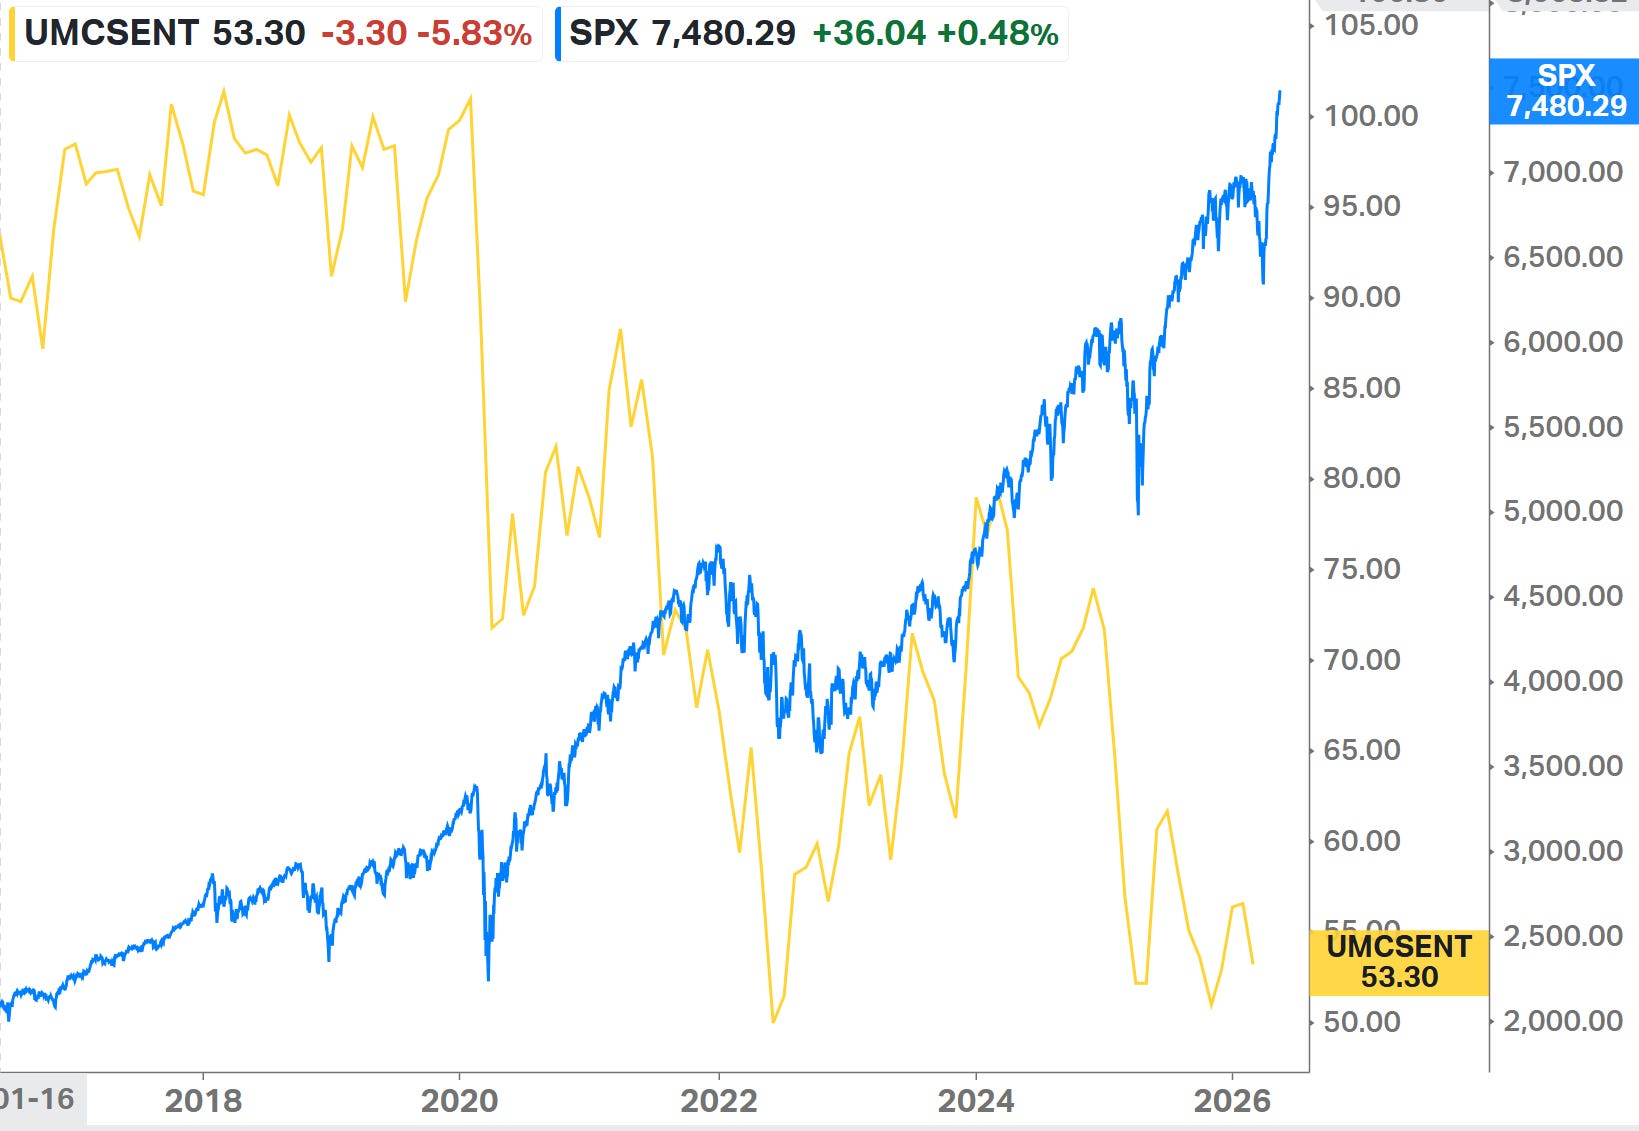
A takeover of the US equities market by foreign investors and passive vehicles; leading into the equal-weighted index lagging. (2-minute read)
Read more...


Performance Report: Equitable Investors Dragonfly Fund
The Equitable Investors Dragonfly Fund rose by +3.53% in April, outperforming the ASX 200 Total Return benchmark by +1.35%. Top contributors were IODM and Spectur, while Archtis and De.Mem detracted; Equitable sees AI as an opportunity, smaller companies as increasingly attractive versus larger ASX peers, and remains watchful of Middle East-related energy and inflation risks.
Read more...
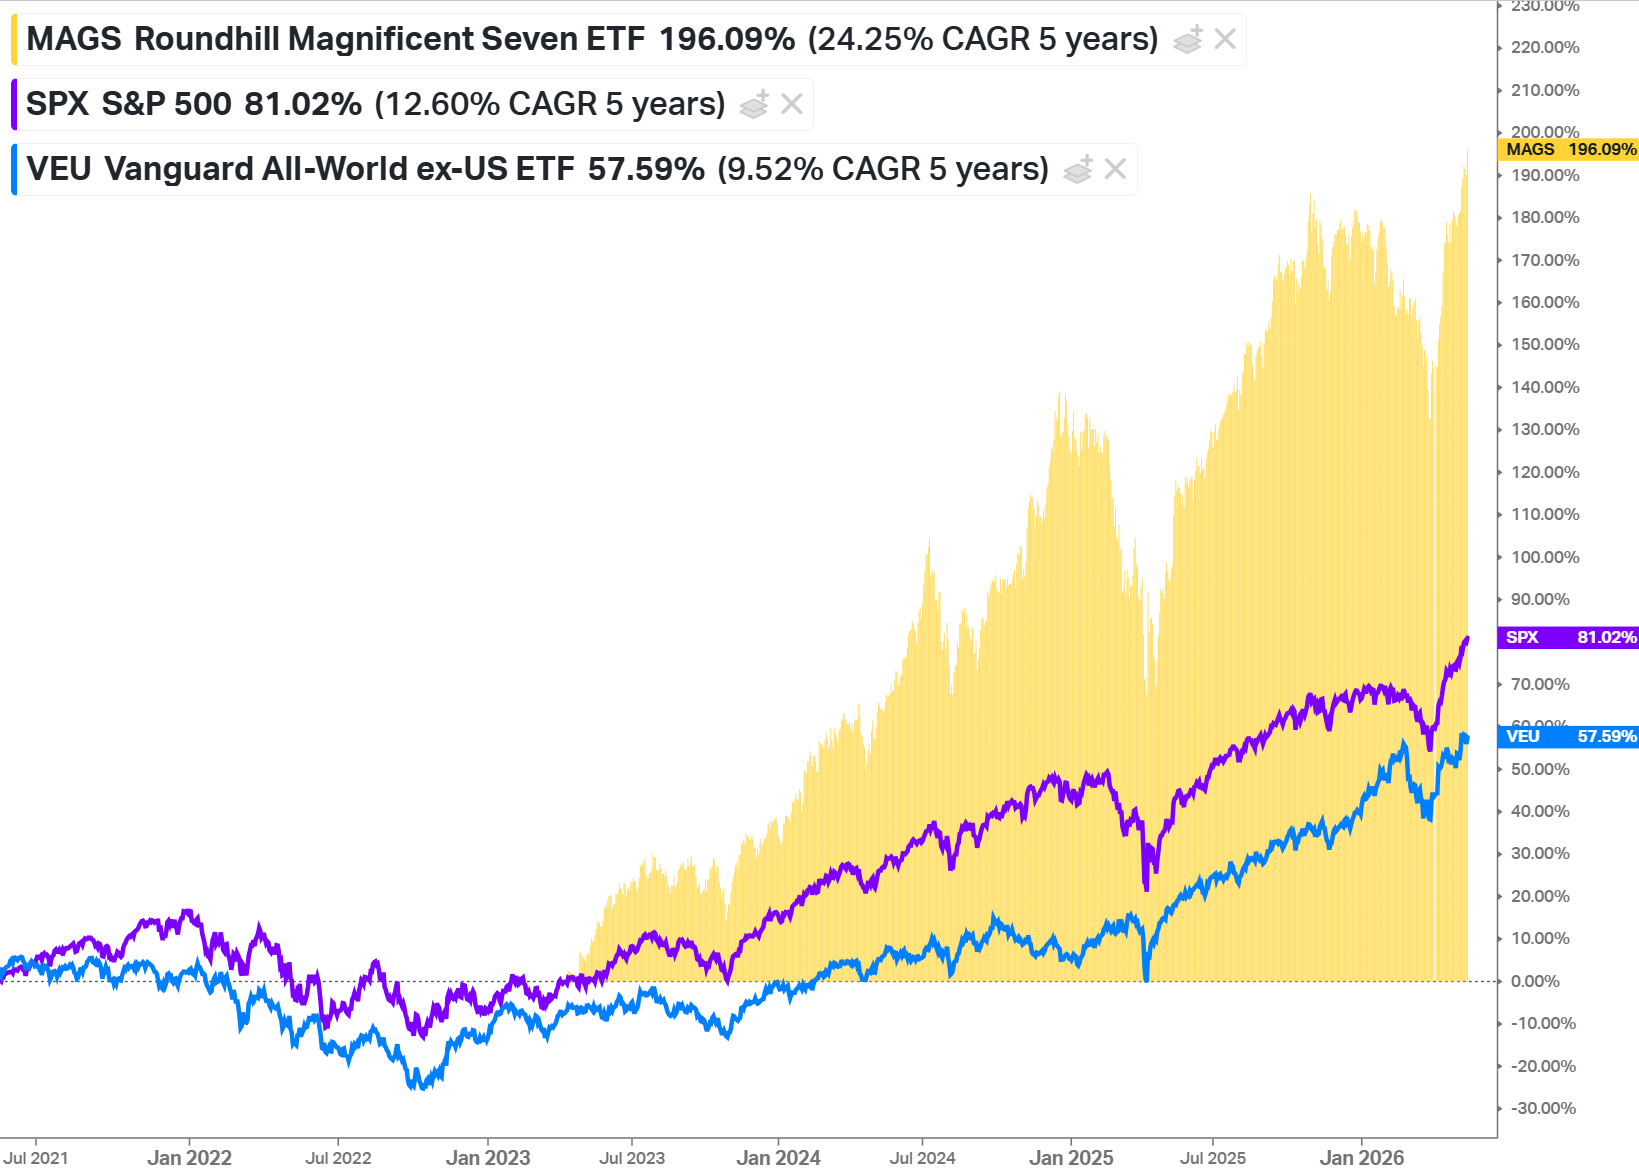
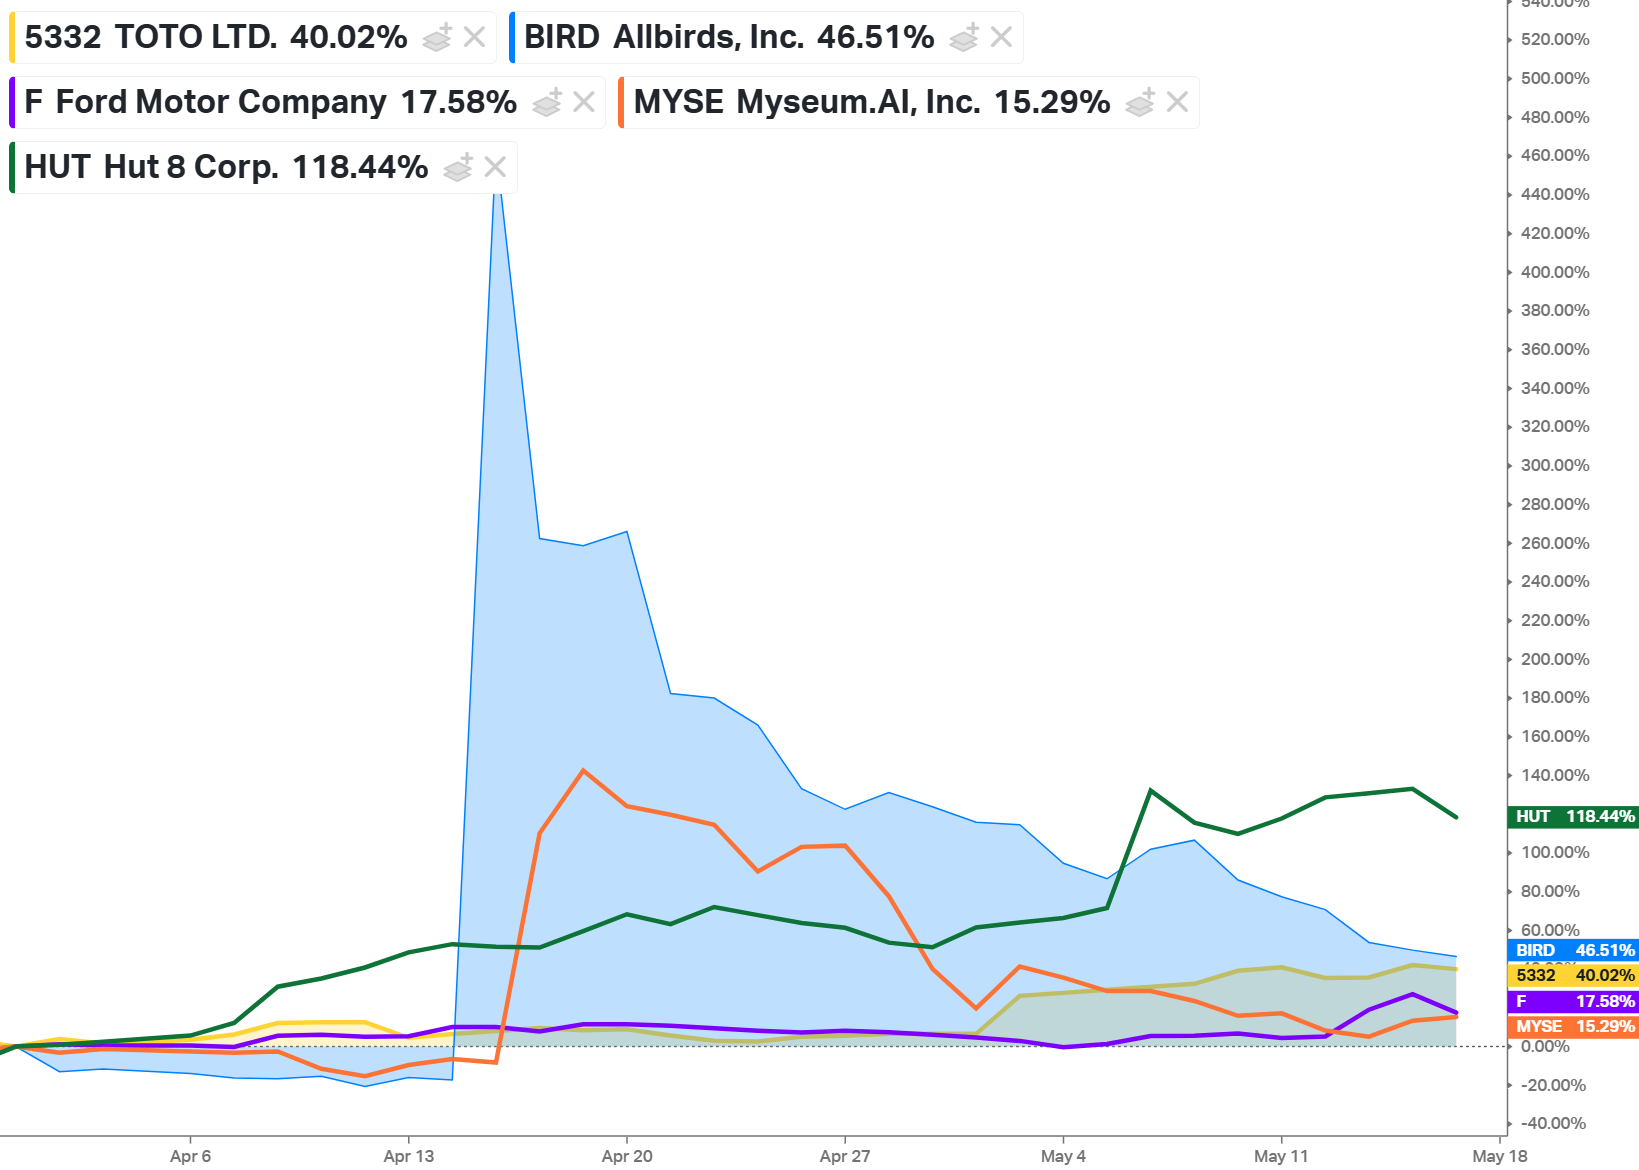
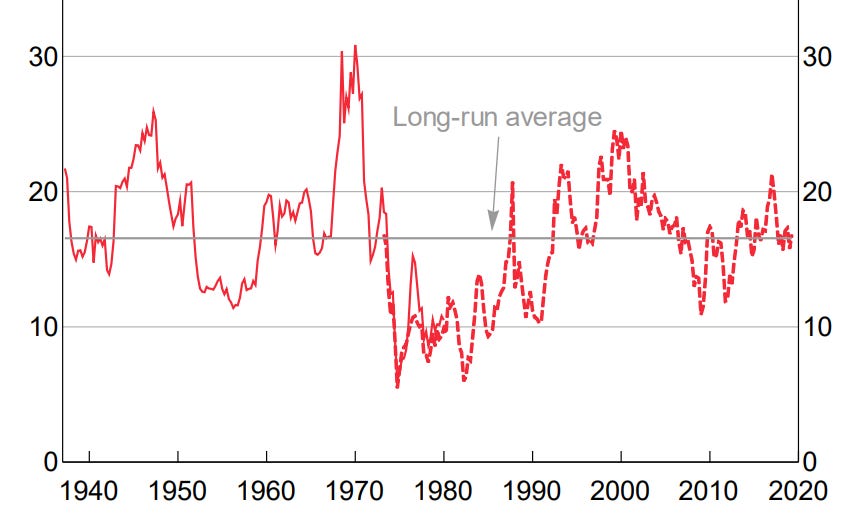
10k Words | May 2026
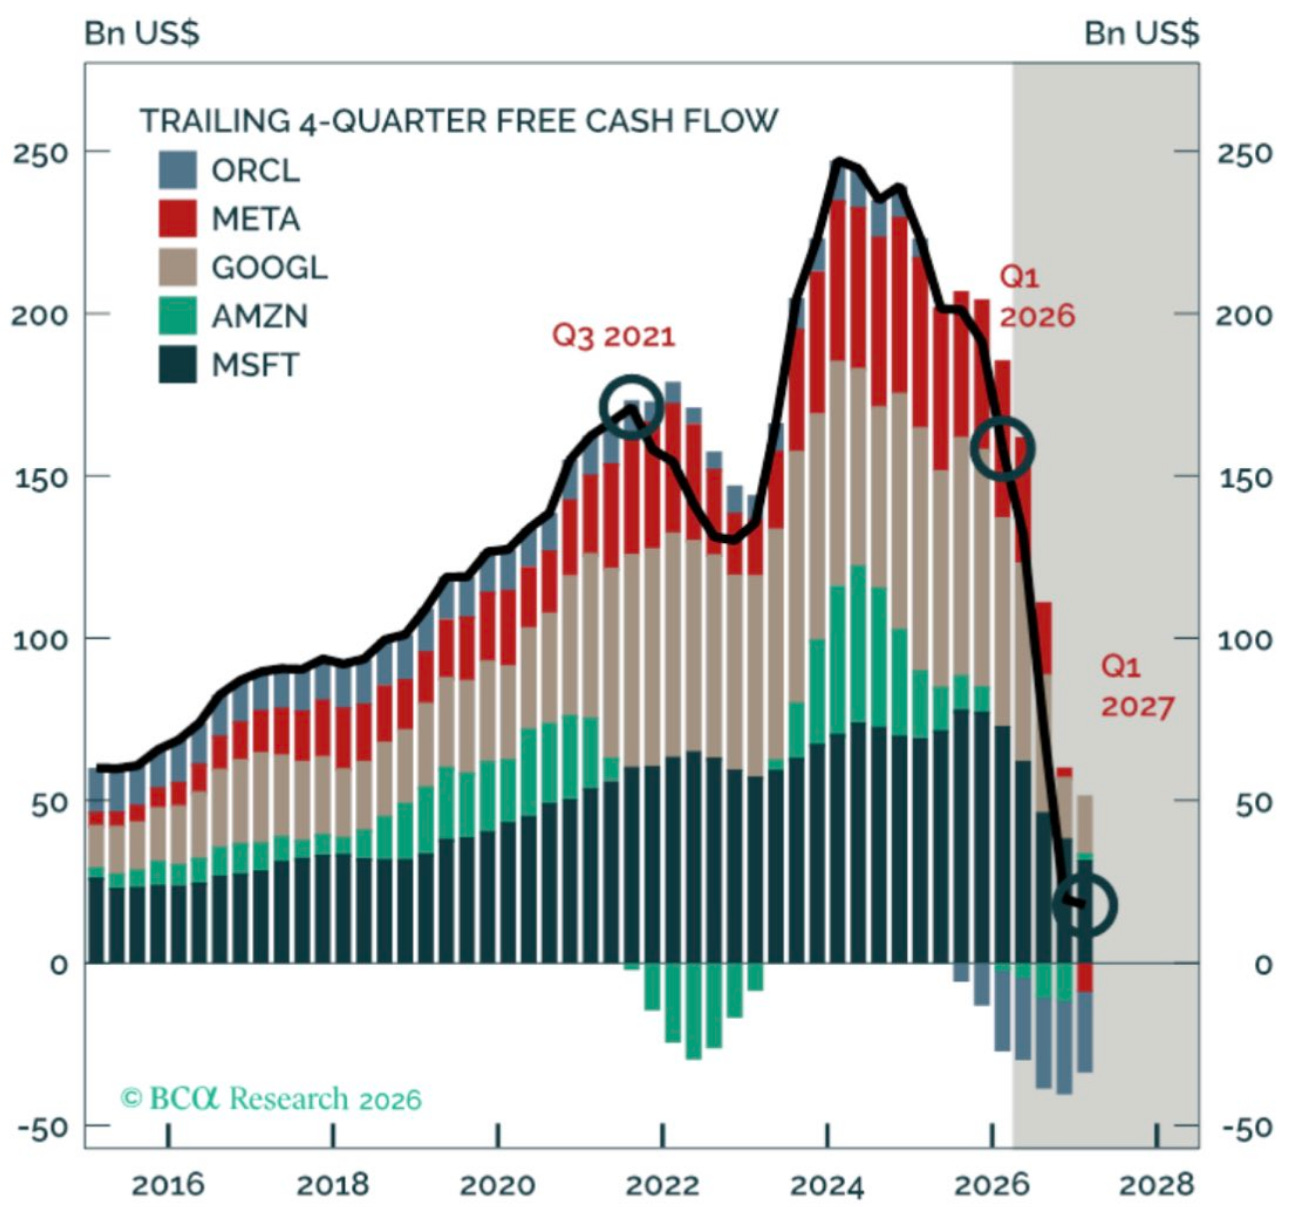
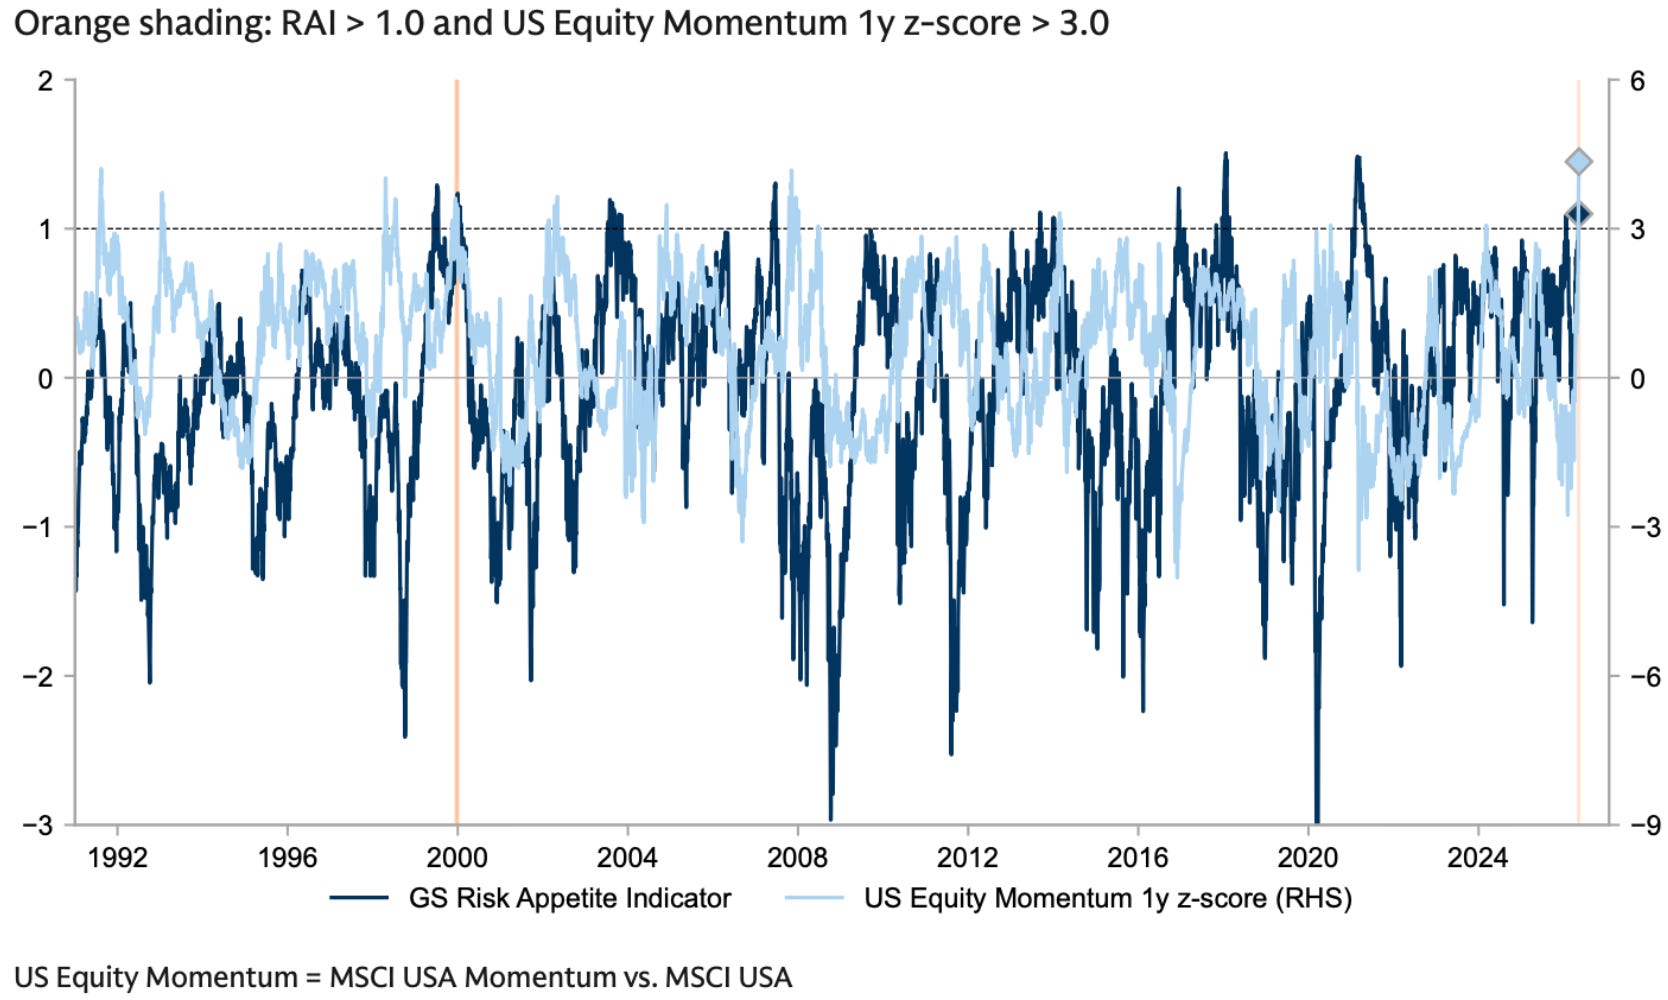
The "Magnficient 7" continue to lead the charge with investors exhibiting a strong appetite for risk. (2-minute read)
Read more...
Fund Performance
Historical Performance (all figures shown here are net of fees unless otherwise stated)
| Year | Jan % | Feb % | Mar % | Apr % | May % | Jun % | Jul % | Aug % | Sep % | Oct % | Nov % | Dec % | YTD % |
|---|---|---|---|---|---|---|---|---|---|---|---|---|---|
| 2026 | -5.53 | -10.08 | -10.24 | 3.53 | -3.33 | N/R | N/R | N/R | N/R | N/R | N/R | N/R | -23.69 |
| 2025 | -3.18 | 0.98 | -6.79 | 3.91 | -1.80 | 6.36 | 9.56 | 1.67 | 6.05 | -0.30 | -4.11 | 2.60 | 14.60 |
| 2024 | -2.54 | 1.48 | -2.23 | 0.53 | 0.01 | -0.34 | 10.10 | -3.57 | 1.43 | -4.96 | 1.40 | -6.18 | -5.66 |
| 2023 | 2.54 | 0.66 | -3.65 | -4.32 | -11.33 | -0.74 | 8.01 | -4.40 | -1.21 | -1.62 | 2.69 | 6.86 | -7.77 |
| 2022 | -8.36 | -2.81 | -3.93 | -2.60 | -8.69 | -8.92 | 0.48 | 2.29 | -20.30 | 1.31 | 1.78 | -6.80 | -45.44 |
| 2021 | -2.53 | 24.98 | -1.94 | 1.43 | -2.29 | -4.44 | 6.84 | 3.09 | 2.95 | 2.19 | -1.65 | -3.18 | 24.83 |
| 2020 | -1.93 | -14.08 | -20.09 | 7.94 | 0.67 | -1.94 | 11.35 | 14.55 | -3.07 | 11.94 | 3.22 | 7.86 | 10.56 |
| 2019 | -0.49 | 1.48 | 0.87 | 0.32 | 1.00 | -6.60 | 2.20 | -4.86 | 4.18 | -2.40 | -0.05 | 3.13 | -1.76 |
| 2018 | -0.20 | -3.17 | -5.76 | -3.96 | -0.85 | 1.48 | -0.06 | -0.39 | 0.27 | -6.19 | -3.68 | -5.99 | -25.38 |
| 2017 | N/R | N/R | N/R | N/R | N/R | N/R | N/R | N/R | 0.87 | 1.08 | 3.44 | 6.71 | 12.55 |
Historical Financial Year Performance (all figures shown here are are percentage per month net of fees unless otherwise stated)
| Year | Jul % | Aug % | Sep % | Oct % | Nov % | Dec % | Jan % | Feb % | Mar % | Apr % | May % | Jun % | FYTD % |
|---|---|---|---|---|---|---|---|---|---|---|---|---|---|
| 2025/2026 | 9.56 | 1.67 | 6.05 | -0.30 | -4.11 | 2.60 | -5.53 | -10.08 | -10.24 | 3.53 | -3.33 | N/A | -11.58 |
| 2024/2025 | 10.10 | -3.57 | 1.43 | -4.96 | 1.40 | -6.18 | -3.18 | 0.98 | -6.79 | 3.91 | -1.80 | 6.36 | -3.70 |
| 2023/2024 | 8.01 | -4.40 | -1.21 | -1.62 | 2.69 | 6.86 | -2.54 | 1.48 | -2.23 | 0.53 | 0.01 | -0.34 | 6.70 |
| 2022/2023 | 0.48 | 2.29 | -20.30 | 1.31 | 1.78 | -6.80 | 2.54 | 0.66 | -3.65 | -4.32 | -11.33 | -0.74 | -34.07 |
| 2021/2022 | 6.84 | 3.09 | 2.95 | 2.19 | -1.65 | -3.18 | -8.36 | -2.81 | -3.93 | -2.60 | -8.69 | -8.92 | -23.53 |
| 2020/2021 | 11.35 | 14.55 | -3.07 | 11.94 | 3.22 | 7.86 | -2.53 | 24.98 | -1.94 | 1.43 | -2.29 | -4.44 | 74.33 |
| 2019/2020 | 2.20 | -4.86 | 4.18 | -2.40 | -0.05 | 3.13 | -1.93 | -14.08 | -20.09 | 7.94 | 0.67 | -1.94 | -26.89 |
| 2018/2019 | -0.06 | -0.39 | 0.27 | -6.19 | -3.68 | -5.99 | -0.49 | 1.48 | 0.87 | 0.32 | 1.00 | -6.60 | -18.26 |
| 2017/2018 | N/A | N/A | 0.87 | 1.08 | 3.44 | 6.71 | -0.20 | -3.17 | -5.76 | -3.96 | -0.85 | 1.48 | -0.96 |