
NEWS

18 May 2022 - The forgotten asset class set to outperform in 2022
|
The forgotten asset class set to outperform in 2022 Yarra Capital Management 05 May 2022
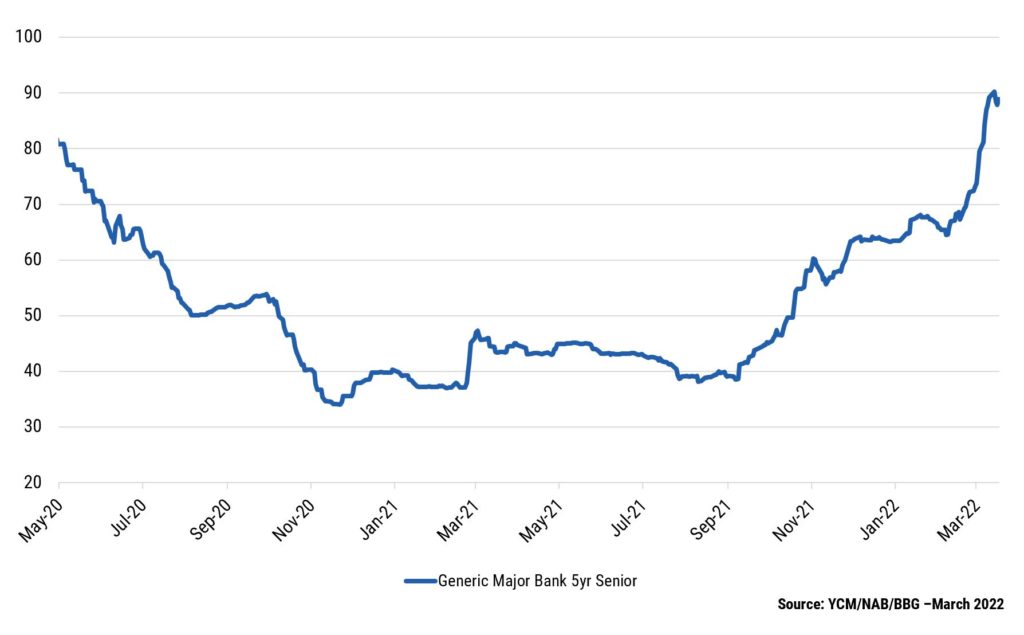
Against a backdrop of economic and geopolitical uncertainty, rising inflation and rate hikes, Australian investors are searching for investments that can benefit from these evolving market conditions. With credit spreads at attractive levels, now might be the opportune time to have exposure to hybrids and credit. With minimal returns on cash continuing to underpin strong demand for hybrid securities, we anticipate demand for yield to remain robust throughout 2022, resulting in strong returns over the year for this asset class. The upside of rising interest ratesRising inflation, above average GDP growth and the unwinding of quantitative easing (QE) in 2022 has seen financial markets reprice interest rate expectations. The rising rate environment will push the outright return on hybrid securities higher, without having a material impact on spreads given the strong economic backdrop. Given most hybrids are floating rate, investors will benefit via higher income from these rising short-term rates. Strong balance sheets you can bank onAustralian banks are the largest issuers of hybrids domestically and their balance sheets are in fantastic shape, with capital ratios at historical high levels. COVID-19 provided Australian banks with access to cheap funding via the Term Funding Facility (TFF), which provided them with a degree of funding certainty and lower funding costs. Following the withdrawal of the TFF in 2021, new bank issuance is coming to market at attractive credit margins, providing the ideal environment for active credit managers to identify the most positive risk adjusted opportunities. For instance, bank senior credit margins are significantly off their TFF lows, which is leading to an attractive re-pricing across all bank capital issuance (refer to Chart 1). Overvalued growth sectors are likely to lead an equity market sell off similar to 2000 - 02, but are unlikely to impact credit market returns. Chart 1: Bank senior credit margins - Well-Off their TFF 2021 lows
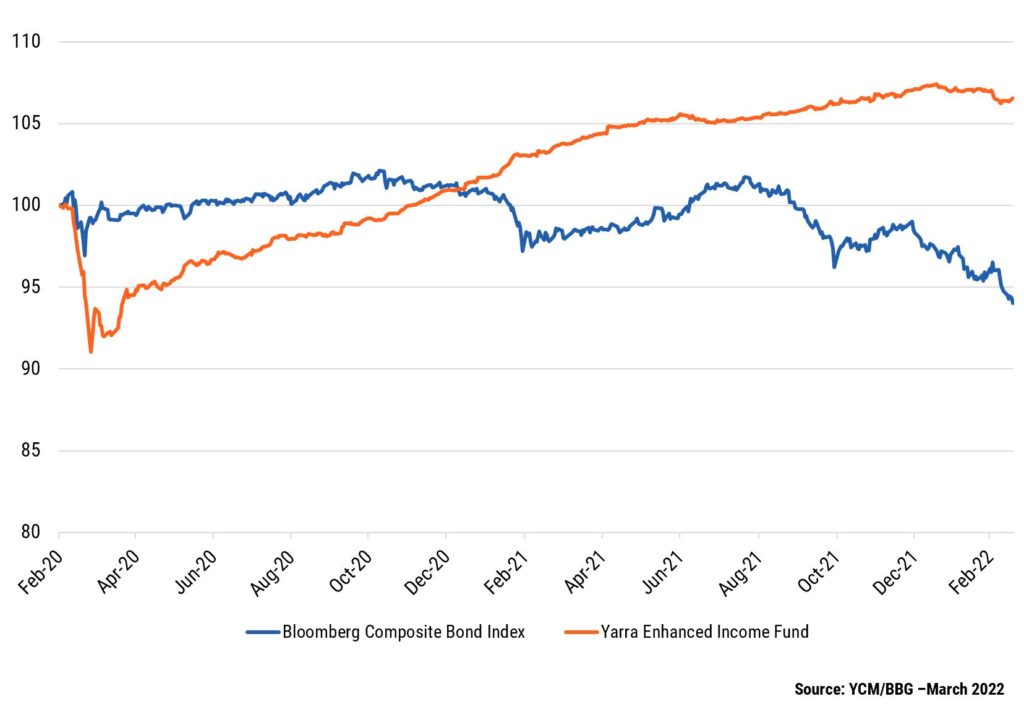
The higher the carry (running yield of an investment), the greater the protection it offers investors from adverse movements in credit margins. The carry for the Yarra Enhanced Income Fund is currently sitting at ~3.0% above cash. Based on an average portfolio maturity of ~3 years, we'd need to see an extreme 1.0% move wider in credit margins to wipe-out the carry. However, given the robust economic backdrop in 2022, we expect credit margins to remain relatively stable throughout, adding to floating rate credit's income generating credentials. This benign outlook is in contrast to the capital losses currently being observed in traditional fixed income due to the reset in interest rates and real yields. Usually, a rise in real yields will impact the value of everything long interest rate duration, from traditional fixed income to most equities. That's not the case with floating rate credit, since its short duration offers protection to portfolio valuations from rising interest rates. This is observable in EIF's outperformance compared to traditional fixed income (Bloomberg Composite Index) since February 2020 (see Chart 2). Chart 2: Floating rate credit with carry continues to outperform fixed rate with little carry
Making the gradeIn a world that seems to be getting riskier by the minute, investment grade hybrids look to be a safe haven for investors. Here's why:
Getting exposure to hybrids and creditBeing able to access fixed rate securities for floating rate portfolios remains a key competitive advantage for Yarra's clients. The Yarra Enhanced Income Fund invests in high yielding, floating rate credit and hybrid securities to deliver better returns than traditional cash management and fixed income investments. |
|
Funds operated by this manager: Yarra Australian Equities Fund, Yarra Emerging Leaders Fund, Yarra Enhanced Income Fund, Yarra Income Plus Fund |


17 May 2022 - What have rubber bands got to do with successful stock selection?
|
What have rubber bands got to do with successful stock selection? Insync Fund Managers April 2022 Lifting of pandemic restrictions has generated an overly enthusiastic view that economically sensitive companies will rebound quickly across many business sectors. Insync deliberately has no exposure to stocks of this ilk. We favour companies that are not only are some of the most profitable companies in the world but are also expected to consistently grow their earnings at high rates regardless of how the global economy performs. As the earnings growth across our portfolio continues to compound at high-rates, the gap grows ever wider between their stock price and their valuations (currently circa 50%+ below valuations). In these shorter periods of relative underperformance, a tension permeates in markets. This creates ideal conditions for entry as a sudden 'snap-back' in stock prices can occur very quickly. Snap backs are triggered by a change in market conditions, an event or simply the market recognizing the big disparities between the companies promising to deliver to the ones actually delivering. We liken it to an elastic band. The more you stretch it (the widening of the gap between valuation and share price), the greater the likelihood of a rapid 'snap-back'. Whilst it's impossible to time exactly when the snap back will occur, when it does do so, it delivers strong outperformance to those stocks with the real underlying earnings and profits to support a sustainable uptick in their price. At the same time, the reverse occurs for those presently leading this latest bout of exuberant price growth. We like value but we are not value Investors. We recently had an extensive meeting with a fund researcher where we took him through our valuation approach. One of his key conclusions was that Insync is a 'value investor'. Whilst we would not describe ourselves as value investors based on conventional metrics (just buying companies based on low Price/Earnings ratios), an important part of Insync's process includes building a high degree of confidence in understanding the worth of a company's future cashflows beyond its present state. To make money involves finding companies where the value we see is significantly greater than the price we have to pay. The current investor exuberance around chasing returns in hyped up sectors has the Insync portfolio of quality growth companies trading at circa 50% below our assessed valuations. A question to ponder is this..... Would you buy into highly profitable businesses if you could buy them at such a large discount? And after doing all your investigations and crunching the numbers, its forward earnings were compounding strongly. Or would you buy a very richly valued popular business whose forward looking numbers don't support its price but everyone was enthusiastic about it today? This is the choice that investors face and this sets up perfect conditions for the Insync portfolio to deliver strong returns. P.S. Insync is of course categorised as a 'Quality Growth' Investor. Traditional valuation metrics are losing their predictive power. PE (Price/Earnings) and PB (Price/Book) ratios have been declining in their ability to predict value. The main reason is in the "E" part of the P/E ratio. Our modern global economy is increasingly driven by intangible assets. Items such as intellectual property, R&D, brands, and networks. In the last decade or so this has accelerated to dominate in many key industries. In the past capital equipment and other tangible assets used to figure large on balance sheets.
'Intangibles' now represent 84% of the market value of the S&P 500 as depicted above. The old focus supported the old P/E and P/B ratios suitability. The problem occurs when it is applied to this new world - to the industries and companies that invest heavily in intangibles. It creates a misleading and distorted picture.
By example, when Pfizer invests R&D in a new drug for Covid-19 (forecasted to generate sales of US$45.7 Bn this year), or Amazon spending on building their cloud capability (sales of US$60 Bn expected from this division), these investments are classified as intangibles. They have to be expensed through their income statements. This means it significantly depresses their earnings today despite these 'investments of expenditure' creating significant sales and profits for many years to follow. Their resulting P/E and P/B ratios are thus negatively impacted. This is important to remember when investing for the future. Beware of using the rear-view mirror. Life has changed. Fastest decline in history. By way of contrast, old-industry companies, say a steel company, has to invest heavily in property and machinery (tangibles). The accounting rules treat these investments as capital expenditures. It immediately goes onto the balance sheet and does not detract from that year's earnings unlike intangibles. Effectively this inflates its present earnings and the book value. P/E and P/B ratios look good.
This inconsistent treatment of the drivers of future growth between intangibles and tangibles leads to wrong conclusions on what actually represents good value and what does not. P/Es are thus not a useful indictor for industries with high intangibles, and even more misleading if taking an average across a broad index. Conventional portfolio blending methods. Many research houses lump funds managers into simplified groupings primarily based on P/E ratios. Growth managers tend to be holding businesses with higher than market average P/E or P/B ratios. Value managers holding a portfolio of low P/E ratios, and GARP or Core managers somewhere in-between. Not only is this old measure being over-used to compare managers in the same group, it is further adapted as the primary means of blending managers across entire client portfolios and investment models. People tend towards simplicity even if its misleading. Given the change in intangible expenditures this is an increasingly unwise approach for professional advice givers. It is also worth noting that P/B and P/E ratios represent two of the three variables used to determine stock inclusion in the widely followed style index, MSCI World Value. The key driver of future earnings - intangibles, is not being appropriately reflected in the income statements and balance sheets in a rapidly changing economy. Accounting rules have not yet adapted. This, we strongly contend, is a key reason for the long-term underperformance of Value indices post the Global Financial Crisis. Intangibles- a key to investing in today's world Even though it is impossible to measure the value of intangibles precisely, it is essential for investment professionals to come up with a logical approach to incorporate intangibles into their decision making; otherwise, they risk being relics in this new age of information. At Insync we have developed a systematic way of incorporating the cashflows that intangibles are delivering into our valuation methodology. This results in a more accurate assessment of the value of a business and a key reason of our successful stock selections. Funds operated by this manager: Insync Global Capital Aware Fund, Insync Global Quality Equity Fund Disclaimer |


16 May 2022 - New Funds on Fundmonitors.com
|
New Funds on FundMonitors.com |
|
Below are some of the funds we've recently added to our database. Follow the links to view each fund's profile, where you'll have access to their offer documents, monthly reports, historical returns, performance analytics, rankings, research, platform availability, and news & insights. |
|
|
|||||||||||||||||
| GQG Partners Global Equity Fund - AUD Hedged | |||||||||||||||||
|
|||||||||||||||||
|
GQG Partners Global Equity Fund - Class A |
|||||||||||||||||
|
|||||||||||||||||
|
GQG Partners Emerging Markets Equity Fund - Class A |
|||||||||||||||||
|
|||||||||||||||||
|
|
|||||||||||||||||
| Longreach Energy Income Fund | |||||||||||||||||
|
|||||||||||||||||
| View Profile | |||||||||||||||||
 |
|||||||||||||||||
| Microequities Value Income Fund | |||||||||||||||||
|
|||||||||||||||||
| View Profile | |||||||||||||||||
|
Want to see more funds? |
|||||||||||||||||
|
Subscribe for full access to these funds and over 650 others |


16 May 2022 - Earnings growth is becoming a priority
|
Earnings growth is becoming a priority Montgomery Investment Management April 2022
Over the years I have often sat alongside guests on a TV or radio panel and heard them conclude the easy gains have been made. For the first time in many years I agree. In recent years investors have made substantial gains from equities but a close look at the driving force behind those gains is likely to reveal investors won because the tide was rising. Sure, many companies grew their earnings too but there were a huge number of companies whose share prices went parabolic despite the absence of earnings. A rising tide does indeed lift all boats, but don't mistake a rising tide for genius, or so the axiom goes. Since 1979, without exception, every period of inflation and or rising interest rates, was accompanied by a contraction in price to earnings (PE) ratios. And using data back to the 1980s, we find the decline in the earnings multiple is greatest when interest rates move up from lower starting levels, just as we are witnessing now. For the last four decades, whenever inflation or interest rates have risen, the multiple of earnings investors have been willing to pay for a share in a company has declined. In every one of the seven phases when US 2-Year Treasury yields rose between 1980 and today, the US S&P500 12-month forward PE Ratio declined. In other words, if Jerome Powell and his team at the US Federal Reserve continue on the path articulated in our blog post The End of Zero, investors can kiss goodbye the easy wins resulting from shares simply becoming more popular, and that rising popularity being reflected in ever expanding PE multiples. I will go so far as to suggest we are, right now, in a period of adjustments to a regime of lower PEs. Plenty of investors haven't yet worked that out and this can be seen in the steep gains for almost all equities amid the hope and talk of peace in Ukraine. Fundamentally however, rates are rising. And while I think rates will rise by less than the most bearish forecasts, the impact on PEs is already underway. Going forward Investors should now be looking at the quality of their portfolios and seek at least some exposure to high quality growth. If a company, with earnings of $10 per share, sees its PE of 35 times fall to 25 times, the share price will decline 28 per cent, from $350 down to $250. Plenty of high-quality growth companies have experienced this, and worse. And that represents a new opportunity. In an environment of high short-term inflation expectations history tells us not to expect expanding PEs. If the best we can hope for is PEs remain static, the way to generate capital growth will be from earnings growth. If the PE ratio for our hypothetical company stays at 25 times earnings, the share price will return to $350 provided earnings grow 40 per cent to $14 per share (E$14 x PE25 = Px$350). The work investors need to undertake now is to uncover those companies able to grow. One place to look is among those companies enjoying structural or megatrend tailwinds. And if among those companies you also find a capital light and highly profitable business with net cash on the balance sheet, more power to you. Avoid capital intensive, low growth, mature, cyclical, geared businesses, or those with lumpy contract-type revenues, and those exposed to discretionary spending (unless they are on a store roll-out tear) and those companies playing in the revolving door of capital - paying out cash, they need later, as dividends today and subsequently raising dilutive capital to replace it. In the next period investors will be wise owning businesses selling products and services with inelastic demand and the recipients of non-discretionary spending. Think of Microsoft - nobody is going to cut their subscription to Microsoft Office just because Jerome Powell said interest rates are going up, or because Putin decides to invade Ukraine. Inelastic services like Microsoft Office are entrenched in the daily systems of hundreds of millions of businesses and individuals. That durability provides Microsoft low cyclicality, higher profitability, stable, recurring and growing cash flows and little or no need for debt. Another company that comes to mind is held in the Polen Capital Global Growth Fund; Adobe. Adobe's Digital Media products enjoy a near monopoly and are "industry standard". Adobe creates and markets software for creative professionals and hobbyists. Its digital media segment supplies 70 per cent of revenue and 90 per cent of it is recurring. Meanwhile its SaaS based digital marketing solutions for enterprises produces 24 per cent of revenue, while Print & Publishing is two percent. In 2011 Adobe commenced a transition to annual subscription-based sales, forever altering the company from a "boom, bust" product cycle business to a predictable, subscription-based model. Unsurprisingly the company generates a return on invested capital of 33 per cent, a return on equity of 43 per cent, has US$1.1 billion of net cash on its balance sheet, produced earnings growth in 2021 of 23.6 per cent, free cash flow growth of 29 per cent and an operating margin of 45 per cent. They are numbers most businesses owners would be envious of. But when Adobe recently announced it was ceasing new sales to Russia and not collecting on subscriptions there, the share plunged nearly 10 per cent. Great! Since its share price highs last year, the shares have declined 37 per cent. Sure, the rate of growth that saw revenue of US1.6 billion in 2004 rise to US$15.8 billion in 2021 may slow but this is a structural growth story, a very high-quality company and remember, shares prices generally track earnings if the PE remains constant. And finally, let us say interest rate rises have the desired effect of reducing inflation. Well, what follows is disinflation and in a disinflationary environment, when the economy is still growing, PEs expand again. That would be icing on the cake for investors who heed the suggestion to invest in quality growth after share prices have been slammed by contracting PEs. Author: Roger Montgomery, Chairman and Chief Investment Officer Funds operated by this manager: Montgomery (Private) Fund, Montgomery Small Companies Fund, The Montgomery Fund |


13 May 2022 - Companies spearheading disruption hit value territory
|
Companies spearheading disruption hit value territory Loftus Peak April 2022 Semiconductors sell off The semiconductor pull-back accelerated in March. Investor concerns centred on slowing demand for consumer electronics in the wake of economic pressures brought on by inflation and interest rate hikes. Severe lockdowns in China related to COVID also added to these fears. Readers will recall that a few months ago we wrote extensively about how semiconductors are playing a burgeoning role for consumers and businesses. We also explained why this trend is likely to continue, driven by secular growth drivers such as Cloud, the Internet of Things and automotive (where silicon content will increase from virtually nothing to 20% of a premium car's bill of materials (BOM) by 2030 - see illustration above). Despite the market's fears, it is worth highlighting that for a majority of our semiconductor holdings, demand still far outstrips supply. This implies that over the short-term any reduction in consumer electronics demand is likely to be taken up by other, new verticals where demand looks set to double, and possibly double again. Given all this we think that the recent sell-off is overdone. A very simple way to illustrate this point is to compare the forward Price-to-Earnings (PE) ratios of semiconductor companies to that of the broader market (S&P500). That is, how much are investors paying per dollar of a company's earnings in twelve months time. We don't use relative measures like this to drive investment decisions, but much of the market does, so at the very least it's useful as a rough guide. Logically, investors should be willing to pay more for companies that are growing earnings faster, all else equal. But this isn't the case when it comes to many of the key semiconductor companies underpinning much of the world's disruption. Take Qualcomm for example, a company that is already essential in 5G for smartphones and increasingly so in connected devices (for example dog collars with GPS trackers) and automotive. It is currently trading at a forward PE ratio of 13x and is expected to grow its earnings by 70% in 2022. This compares to the broader market (S&P500) which is trading at a forward PE ratio of closer to 20x and is expected to grow earnings by 15% in 2022. The market is paying almost twice as much for less than a quarter of the earnings growth! In addition, the 13-year discounted cash flow model we maintain on the company confirms this under-valuation. It is in times like this that our investment philosophy and process provide comfort. Our valuation methodology is informed by how the world is changing and the direction in which it is heading, typically a longer time horizon than that of the broader market. We firmly believe that the market will 'capitulate' on its negative semiconductor stance as key companies continue to deliver exceptional earnings results, evidencing their growing importance across many industries. It is this process that has produced favourable outcomes for clients over the almost eight years we have been managing the strategy. Semi We don't invest in Russian companies, and have dramatically reduced our holdings in Chinese companies in the past year, a position which has hardened since the overly friendly deal struck between the leaders of the two countries, Vladimir Putin and Xi Jinping, during the Winter Olympics, and which preceded the invasion of the Ukraine by just four days. Russia could have been lumped in with investment in the 'emerging markets' asset class, but frankly, it never made the cut. Putin's financial and political relationship with the oligarchs, the bedrock of the kleptocracy, made buying into Russian companies like search engine group Yandex opaque at best. There were many other reasons as well. He has systematically cracked down on media freedom, jailed political opponents and passed legislation authorising the murder of enemies of the state outside Russia (symmetrical with the powers it had within Russia), which of course resulted in the radioactive poisoning of Putin critic Alexander Litvinenko in the sushi bar of London's Millennium Hotel. Had we ignored the geopolitics and invested in Russia - on the basis of low financial valuations of many companies - the outcome would have been negative given that the economy has been crippled by the sanctions now being applied by NATO countries and others. China too has become increasingly difficult as an investment proposition. We first included companies in China because the political environment styled 'socialism with Chinese characteristics' had unshackled the economy and created the super-growth for companies such as Alibaba, which disrupted bricks-and-mortar retail, banking and transport. This also made a material difference to the lives of many Chinese people. Of course, there was always a measure of autocracy, but the balance that was struck allowed enough private enterprise for commerce to thrive and set China on a tear that lifted 850 million people out of rural poverty and into the middle class. The most obvious marker that there was to be a change was the 2017 crackdown in Hong Kong by President Xi. The situation continued to deteriorate over the following years, and then Xi canned the float of Ant Financial and levied Alibaba with a US$15b fine - a 'common prosperity' payment. Later, China Inc nobbled the ride-sharing company Didi, until that moment a credible competitor to Uber. At many points in the past five years there was a temptation to suggest the changes in China couldn't get worse. But in October last year Xi upped the ante on Taiwan, flying 150+ fighter jet sorties over Taiwanese air space on the 100th anniversary of the birth of the Chinese Communism Party. The clear message: Taiwan must become part of China again. Sound like Russia's approach to Ukraine? It's no surprise that the countries with the strongest innovation track records are also those with the most liberal political structures. Ever wonder why South Korea is such a technology powerhouse, while North Korea… isn't? Or why Taiwan's TSMC is the largest and most successful semiconductor manufacturer in the world, while China lags, or for that matter why there isn't a Russian Apple? It isn't that the folk aren't as smart - more a case of where is the incentive to build a great company if it can be appropriated by the state and its mates? Which is not to say that liberal democracies are motivated by altruism. The semiconductor industry built by William Shockley, then his employees at Fairchild and Andy Grove at Intel was underwritten by the US wish to dominate weaponry and space, requiring top grade guidance systems which required the latest silicon. Geopolitics and our investment process For Loftus Peak, as managers of the Fund, geopolitical matters such as these are expressed in the valuation process by the discount rates used to determine entry and exit prices. Companies listed in countries with autocratic political systems mostly attract higher discount rates. This results in the price targets we ascribe to companies operating in these countries being lower and so too the Fund's overall exposure in terms of weighting to those countries. The outcome of this is an absence of holdings in Russia and a low weight to holdings in China, both of which have broadly worked. Performance and portfolio positioning An appreciating Australian dollar drove the weakness in absolute performance and the pullback in semis led to relative underperformance against the benchmark of -2.0% in March against our benchmark MSCI All Countries World Index (net, as expressed in AUD from Bloomberg). We believe the market has started to recognise the value of quality companies - those with robust business models, pricing power, strong balance sheets and cash flows. We expect this trend to continue as the macroeconomic environment begins filtering through to company earnings. We recognise that during times of uncertainty - war, inflation, interest rate hikes - markets tend to focus on that which is directly in front of them (the next quarter, or two). However we take a longer-term view and gain comfort in the Fund's positions knowing their growth is being driven by powerful secular trends that will continue for the next decade and that many of these quality companies are now trading at even more attractive prices. We took advantage of the market lows in March to increase our weighting to equities by around 5%, purchasing a number of quality companies that had been on our watch list but were previously precluded from the portfolio on the basis of valuation. Cash exposure at the end of March was 7.4%. Funds operated by this manager: |
12 May 2022 - New fund launch & Monthly Report
|
New fund launch & Monthly Report Collins St. Asset Management April 2022 The Co-Founders of Collins St Asset Management, Michael Goldberg and Vasilios Piperoglou, alongside Head of Distribution & Investor Relations, Rob Hay, are hosting an interactive webinar (existing clients only) where they will be sharing their insights into the investment thesis underpinning the launch of the upcoming Convertible Note Fund. With capital preservation at the heart of the team's philosophy, Michael and Vasilios will articulate the compelling asymmetrical risk / return outcomes that can be achieved through convertible note exposure and how debt like downside / equity like upside can create the potential for an 8% p.a. yield as well as capital appreciation over the medium term. The team at Collins St Asset Management have developed deep knowledge and experience in the field of convertible notes, having completed numerous transactions with profits of between 30% and 100% within the flagship Collins St Value Fund since 2016. Throughout that time the investment process has continued to evolve and be refined to the point where Collins St Asset Management are regularly being introduced to new opportunities with the volume of potential transactions being greater than what could be exclusively accommodated within the Collins St Value Fund. To that end, and as a natural extension of the same research process that has delivered investors a net return of 19.1% p.a. since inception in the Collins St Value Fund, the team are excited to present this opportunity to you and look forward to your attendance at the webinar. *Please note that past performance is not a reliable indicator of future performance and ensure you receive and read a copy of the Information Memorandum for the Fund in full prior to making any investment decision with respect to the Fund. The Fund is available to those investors who qualify as 'wholesale' or 'sophisticated' only. Speakers: Funds operated by this manager: |

12 May 2022 - One of the ASX's most impressive stocks
|
One of the ASX's most impressive stocks Airlie Funds Management April 2022
|
|
In the search for high-quality businesses that are undervalued, one of the richest hunting grounds is a 'jewel in the crown' scenario, whereby a great business is hidden within a languishing conglomerate. One of Airlie's core holdings, Tabcorp (TAH.ASX), presents such an opportunity, operating a high-quality Lottery division whose stellar performance has historically been overshadowed by a structurally challenged Wagering division. Fortunately for shareholders, Tabcorp management have made the astute decision to demerge this 'jewel' into a new listed vehicle, The Lotteries Corporation. Whilst this process has already served to unlock material value for shareholders, we believe the market continues to undervalue the infrastructure-like qualities of this Lotteries division. The Lottery Corporation (Lotteries & Keno) In Australia, Lottery licences are awarded exclusively on a State-wide basis, with Tabcorp currently holding all State licences bar Western Australia (operated by the WA Government). These state-based monopolies exhibit very similar traits to infrastructure concessions; licences are typically long-duration (ranging from 10 to 40yrs in length), demand for the product is insensitive to economic cycles, feature strong pricing power, and offer very dependable and predictable cash flows. However, lottery concessions are far less capital intensive than their typical infrastructure counterparts. In fact, we estimate that Tabcorp's Lotteries division generates a return on invested capital north of 50%! The crucial factor for a concession operator is whether future licences can be renewed on attractive terms. For lottery concessions specifically, there are some important aspects that heavily favour the incumbent during the bidding process. The most obvious of these being the benefit of scale; Tabcorp are the only private operator of Lottery licences in Australia. This means that any fixed costs related to technology, systems and processes can be shared across the various State licences, resulting in higher profit margins. Given these economies of scale, Tabcorp can operate any individual licence more profitably than a new entrant and thus the company can bid a higher price for that licence. Continuity is also an important consideration during the bidding process. The State Government issuing the licence generates material tax revenue based on the value of lottery tickets sold. Any new entrants would need to replicate Tabcorp's existing retail network, customer lists, infrastructure, systems and processes whilst ensuring no drop in turnover (and tax revenue) for that respective State Government. These State Governments are larger stakeholders in the Lottery operations than even Tabcorp itself; over just the last 3 years, the Lotteries segment has paid over $5.1bn in State taxes, dwarfing Tabcorp's own estimated profits of <$1bn. It is clearly in the best interest of the various State Governments to maximise the turnover performance of the Lotteries licences rather than attempt to squeeze extra margin by switching operator. The only material upcoming licence renewal is the Victorian Lottery licence in 2028. Interestingly, whilst Victoria is one of the highest lottery turnover States, it is also one of the lowest margin licences given the State's higher lottery tax rate. Back in 2012 when Tabcorp acquired the South Australian Lottery licence, they disclosed Victoria's 'operator margin' at 3.9%, compared to 9.2% and 10.5% for NSW and QLD respectively. Importantly, any new entrant seeking to gain material scale in the market would need to wait until 2050 for the opportunity to bid on the NSW licence. Tabcorp has lost a portion of the Victorian licence before, when Intralot were awarded the instant scratchies portion of the licence back in 2007. However, after 6yrs of operation and a reported $63m in losses, Intralot forfeited the licence and it was awarded back to Tabcorp. Due to these structural advantages, Tabcorp's Lotteries & Keno business has one of the most impressive track records of any listed ASX business, growing earnings before interest and tax (EBIT) at a compound annual rate of 9% over the last 10 years. As impressive as this track record appears, the earnings momentum here is actually understated; during the Tabcorp/Tatt's merger in 2018, $65m in costs were reallocated to the Lottery segment, negatively impacting earnings. As can be seen in the chart below, this change in accounting policy had the effect of materially reducing profit margins in FY17 despite having nothing to do with the fundamental performance of the business. Margin expansion has driven much of the segment's historical growth in earnings, but importantly there are several reasons to believe this can continue; (1) continued economies of scale as the company's fixed costs are spread across a larger revenue base, (2) increasing digital penetration which avoids the ~10.3% commission paid to newsagents, and (3) the superior terms recently negotiated with lottery reseller Jumbo Interactive (JIN.ASX). The new Tabcorp (Wagering, Media and Gaming Services) The remaining Tabcorp stub will include the Wagering, Media and Gaming Services businesses. The lion's share of value here is in the Wagering & Media operations. Under the TAB brand, Tabcorp holds the exclusive licence to conduct wagering operations in retail venues across all Australian States and Territories excluding Western Australia. This retail monopoly is facing structural disruption as punters increasingly elect to bet with online bookmakers such as SportsBet, Ladbrokes and Bet365. Whilst Tabcorp have their own online channels, these digital-first competitors offer superior customer functionality, products and branding, as well as enjoying structural opex and tax advantages. The earnings track record of the Wagering & Media business reflects these difficulties. But there are glimmers of hope emerging; Tabcorp now generates over $9bn in digital wagering turnover, representing around 55% of total wagering turnover for the group. On a digital-only basis, Tabcorp is the second largest player in the market, with a 21% share of turnover. Furthermore, recent regulatory changes have helped to level the playing field between Tabcorp and its online competitors by reducing structural tax disadvantages. Clearly other interested parties see value here; Tabcorp has received multiple bids within the last year valuing the Wagering & Media business at $3.5bn ($4bn including the Gaming Services business). Whilst there are significant impediments to completing a transaction (change of ownership provisions and racing body approvals), this does give some indication of the underlying value within the segment not reflected in the current earnings momentum. Valuation: If we ascribe a valuation of $3bn to the Tabcorp stub (a material discount to the recent $4bn bid from Apollo Global Management), we get an implied earnings multiple for The Lottery Corporation of 19x FY22 EBIT. This reflects a 24% premium to the median EV/EBIT of the ASX300 ex-financials and resources. However, on a normalised cash flow basis - adjusted for return on capital employed - The Lottery Corporation is trading about in line with the market despite its superior growth outlook. As can be seen in the table below, the company also compares favourably on a number of metrics to listed toll toad concession operators, Transurban and Atlas Asteria. For this reason, despite the strong share price performance, we continue to see material upside in this core holding. Author: Will Granger, Airlie Investment Analyst Funds operated by this manager: Important Information: Units in the fund(s) referred to herein are issued by Magellan Asset Management Limited (ABN 31 120 593 946, AFS Licence No. 304 301) trading as Airlie Funds Management ('Airlie') and has been prepared for general information purposes only and must not be construed as investment advice or as an investment recommendation. This material does not take into account your investment objectives, financial situation or particular needs. This material does not constitute an offer or inducement to engage in an investment activity nor does it form part of any offer documentation, offer or invitation to purchase, sell or subscribe for interests in any type of investment product or service. You should obtain and consider the relevant Product Disclosure Statement ('PDS') and Target Market Determination ('TMD') and consider obtaining professional investment advice tailored to your specific circumstances before making a decision to acquire, or continue to hold, the relevant financial product. A copy of the relevant PDS and TMD relating to an Airlie financial product or service may be obtained by calling +61 2 9235 4760 or by visiting www.airliefundsmanagement.com.au. Past performance is not necessarily indicative of future results and no person guarantees the future performance of any financial product or service, the amount or timing of any return from it, that asset allocations will be met, that it will be able to implement its investment strategy or that its investment objectives will be achieved. This material may contain 'forward-looking statements'. Actual events or results or the actual performance of an Airlie financial product or service may differ materially from those reflected or contemplated in such forward-looking statements. This material may include data, research and other information from third party sources. Airlie makes no guarantee that such information is accurate, complete or timely and does not provide any warranties regarding results obtained from its use. This information is subject to change at any time and no person has any responsibility to update any of the information provided in this material. Statements contained in this material that are not historical facts are based on current expectations, estimates, projections, opinions and beliefs of Airlie. Such statements involve known and unknown risks, uncertainties and other factors, and undue reliance should not be placed thereon. Any third party trademarks contained herein are the property of their respective owners and Airlie claims no ownership in, nor any affiliation with, such trademarks. Any third party trademarks that appear in this material are used for information purposes and only to identify the company names or brands of their respective owners. No affiliation, sponsorship or endorsement should be inferred from the use of these trademarks.. This material and the information contained within it may not be reproduced, or disclosed, in whole or in part, without the prior written consent of Airlie. |
12 May 2022 - Big Player - Investment Snapshot
|
Big Player - Investment Snapshot Insync Fund Managers April 2022 Thanks to COVID-19 online shopping has catapulted in popularity. Subsequently, so has the Buy Now Pay Later (BPNL) universe. But, with so many BPNL players in the industry, which one do you choose? Size does matter and reach is paramount for merchants who want to offer a range of payment providers but must nearly always include bigger players like PayPal. PayPal wins for merchants and many purchasers because: 1. PayPal has 396 million customers 2. PayPal processes approximately 60% of all online retail spending (ex-China) 3. PayPal thrives without late fee income unlike most competitors 4. PayPal is already indirectly in the Chinese market via Go Pay and Shanghai-based Union Pay with potential to reach 500 million Chinese shoppers 5. Information Technology Resources - PayPal launched its BNPL response far quicker than any smaller player could imagine Merchants don't want a window full of logo stickers for payment providers and Millennials are too savvy to have a phone full of BNPL apps. They want proven providers when managing their money and money transfers. Other Global Tech stocks/themes include: NVDIA, Amazon, VISA, Apple Pay, Nintendo, Hydrogen, and Low Emission energy.
Insync's investment strategy concentrates on disruption and its interrelationship with a global Megatrend rather than just investing in disruptive companies. Our investment philosophy revolves around high quality companies. We look for companies that are benefiting from disruption, have long runways of growth through exposure to global Megatrends and are highly profitable. Funds operated by this manager: Insync Global Capital Aware Fund, Insync Global Quality Equity Fund Disclaimer |

11 May 2022 - Seeking predictable returns during economic turmoil
|
Seeking predictable returns during economic turmoil Laureola Advisors April 2022 Continuing Instability, More War; Credit Excesses. The war in the Ukraine continues with shocking humanitarian suffering and carnage not seen in Europe in 8 decades. The ongoing war and related sanctions will likely lead to sustained inflation, more market instability and heightened geo-political uncertainties. The reaction of the Russian leadership to any failure on the ground cannot be predicted. In China, an outbreak of Covid has led to strict lockdowns, with the inevitable economic downturn and possible social unrest. China has her own deflating financial bubble, primarily in real estate: the yields on major Chinese Developers ranged from 15.5% (Country Garden) to 109% (Evergrande). Excess credit leads to instability in all countries. Real world inflation continues to be an issue - another outcome of credit excess exacerbated by war, Covid and supply-chain problems. Many commodity prices are up double digits, wages are up, and central banks appear to be starting a tightening cycle: the first since 1994, nearly 30 years ago. Most Fund Managers will be seeing one for the first time. Investors must contemplate multiple scenarios, including current inflation, credit instability, rising default rates, and probable deflation in financial assets. Inflation and Life Settlements. Should Life Settlements be part of investors' portfolios in times of inflation? A rational analysis will begin by establishing three assumptions: expected return on the LS portfolio, expected inflation, and the time horizon. The expected return of the Laureola LS strategy is 8% to 12%; the actual return in the past few years has been between 6% and 9%. At least this has the validity of being backed by realised gains.
Mathematically, a 7% return will be helpful, even in a 4% inflation environment. Investors can adjust both figures according to their analysis, but there is a significant buffer. Despite the fixed income characteristics, LS prices are only modestly correlated to interest rates. The IRRs on LS have ranged between 6% and 12% above Treasuries and LS prices have proven to be more dependent on capital flows and liquidity. The prices of LS may vary over the coming 5 years, but the realised return on those already purchased will not be affected. The realised return on LS is reliant primarily on getting the mortality right, and that is why Laureola has such a strong focus on understanding the mortality of each insured. Control for this variable will beat inflation in most scenarios. Performance and positioning Investors are concerned about the effects of inflation on their portfolios. There is no doubt a place for assets that directly protect against inflation, such as commodity exposure, real estate, or possible gold. But a portfolio focussed only on these assets may not do well in other scenarios, e.g. more moderate inflation or deflation resulting from a credit crisis. A stable 7% annual return over 5 years will provide investors with 40% more purchasing power 5 years from now. Laureola has always delivered 7% or better over 5 years and, as the strategy is based on mortality, it brings the added benefits of genuine non-correlation, stability and protection from geo-political and economic shocks. Funds operated by this manager: |

10 May 2022 - Facts are stubborn, but statistics are more pliable
|
"Facts are stubborn, but statistics are more pliable" - Mark Twain FundMonitors.com May 2022 In some analyst's eyes Tracking Error, which measures how closely a fund follows its benchmark index, provides a useful way of measuring both a fund's performance, and value against the index. It is calculated as the standard deviation of the difference between the returns of an investment (or fund) and its benchmark. The theory is that the more active the fund the higher its performance should be compared with the benchmark, and therefore the higher its tracking error should be. Conversely, the lower the Tracking Error, the more closely the fund follows the index. The logic seems straightforward enough: Investors in active funds, and paying "active" fees, don't want to pay the fund manager to simply track the index. Unfortunately the Tracking Error can be a misleading way to evaluate a manager's performance. A more informative way to look at a fund's performance vs its underlying benchmark or index is to measure its Up and Down Capture Ratio. Once understood, they provide a more realistic measurement of a fund's ability to perform in both positive and negative markets. The up capture ratio shows the percentage of the market's gains the fund has captured when the market rises. The higher the up capture ratio, the better the fund has performed in positive markets. Conversely, the down capture ratio shows the percentage of the market's losses the fund captures when the market falls. The lower the down capture ratio, the better the fund's performance in negative markets. So far so good! However, selecting funds based on their relative up and down capture ratios will also be dependent on the investor's circumstances (age, life cycle), risk tolerance and one's market expectations. Down Capture is particularly useful as it indicates the fund's ability to protect capital in falling markets. If an investment loses 20% it needs to gain 25% just to get back to where it started, and if it loses 40%, it needs a return of 66.7% to get back to even. As an example, the Collins St Value Fund and the DS Capital Growth Fund both appear in their peer group's highest performance quintile over 3 and 5 years. This is primarily based on their low down capture ratios of 47.6% and 70.5% respectively. Similarly the Bennelong Australian Equities Fund was also in the highest performance quintile, but based on a high up capture of 131.7%. Importantly both DS Capital and Bennelong had low tracking errors compared to the respective peer group. The L1 Capital Global Opportunities Fund returned an impressive 35.51% per annum for the past 5 years by not having a negative return in any month, resulting in a negative down capture ratio of -131%, while also having a relatively low Tracking Error of 11.5. For most Advisers and Investors it is easy to get lost in a sea of often contradictory statistics that potentially don't tell the full story. It is better to have a high level of diversification, and to concentrate on those statistics that are aligned to your investment goals - whether that be protecting the downside, or making hay while the sun shines! |