
NEWS

25 Mar 2026 - Performance Report: DS Capital Growth Fund
[Current Manager Report if available]

25 Mar 2026 - Emerging Markets: How AI concerns are impacting India
|
Emerging Markets: How AI concerns are impacting India Pendal March 2026 (5 minutes read time) |
|
Fears that rapid advances in artificial intelligence could slow global IT spending have weakened investor confidence in Indian software stocks. Pendal's Global Emerging Markets Opportunities team investigates the implications for India's growth and current account balance. THE explosion in capability of AI models in recent months has led some equity market participants to become more cautious about the outlook for various service sector industries, leading to selloffs in sectors from software to financial planning. As investors who approach the asset-class primarily through top-down, country-level developments, the GEMO team has been thinking about what this might mean for India. India is one of a group of emerging markets that tend to run current account deficits. "These are countries that have significant latent domestic demand but where, for various historical, geographical or institutional reasons, domestic production falls short. These markets tend to have higher beta to global liquidity and risk appetite," says James Syme, senior fund manager, JOHCM. "Most pertinently for India, the growth cycles of these countries tend to be constrained by inflation and external deficits, with both vulnerabilities reflecting demand running too far ahead of supply." Since the end of 2010, India's current account deficit has averaged 1.7 per cent of GDP, although the maximum deficit was 5.1 per cent of GDP. The structure of the current account balance has developed through time, and changed with India's economic cycle, but some components remain structurally important. In 2025, India ran a deficit in non-oil goods of US$189 billion (4.9 per cent of GDP). Net oil imports were US$122 billion (3.2 per cent of GDP). The resultant trade deficit of US$311 billion (8 per cent of GDP) was substantially offset by a net positive services balance of US$210 billion (5.4 per cent of GDP). Notably, the surplus in IT services was US$227 billion (5.9 per cent of GDP). India also ran a positive income balance of US$85 billion (2.2 per cent of GDP), for an overall current account deficit of US$17 billion (0.4 per cent of GDP). Syme says this relationship between IT service exports and oil imports is key for India's economy, and the two have grown together. In fiscal year 2019, net IT service exports were US$85 billion, and oil imports were US$93.9 billion. "The varying cycles in global IT service spending and the oil price are key for the health of the Indian economy," explains Syme. At a time of higher oil prices, what does the downturn in sentiment towards software and IT service stocks mean for India? In the first two months of 2026, the MSCI India IT Index has fallen over 20 per cent in USD terms. "This is concerning, because the aggregate revenue of India's listed IT companies has a high correlation with the economy's IT service exports," says Syme. If the negative outcome that stocks are pricing in comes to pass, particularly with higher oil prices, India's growth may be constrained by the current account balance. "However, it is important to note that the 12-month forward consensus estimates for both the revenues and profits of the constituents of MSCI India IT Index have increased by 3.4 per cent year to date," notes Syme. "This steady growth in the fundamental outlook for these companies suggests both opportunity in the sector, where we remain overweight, and ongoing support for the Indian economic growth story, although we remain underweight the country on valuation grounds. "We do not feel that share price moves alone constitute a macro-level signal for India at this time." |
|
Funds operated by this manager: Pendal MicroCap Opportunities Fund , Pendal Global Select Fund - Class R , Pendal Sustainable Australian Fixed Interest Fund - Class R , Pendal Focus Australian Share Fund , Pendal Horizon Sustainable Australian Share Fund , Regnan Credit Impact Trust Fund , Pendal Sustainable Australian Share Fund , Pendal Sustainable Balanced Fund - Class R , Pendal Multi-Asset Target Return Fund |
|
This information has been prepared by Pendal Fund Services Limited (PFSL) ABN 13 161 249 332, AFSL No 431426 and is current as at December 8, 2021. PFSL is the responsible entity and issuer of units in the Pendal Multi-Asset Target Return Fund (Fund) ARSN: 623 987 968. A product disclosure statement (PDS) is available for the Fund and can be obtained by calling 1300 346 821 or visiting www.pendalgroup.com. The Target Market Determination (TMD) for the Fund is available at www.pendalgroup.com/ddo. You should obtain and consider the PDS and the TMD before deciding whether to acquire, continue to hold or dispose of units in the Fund. An investment in the Fund or any of the funds referred to in this web page is subject to investment risk, including possible delays in repayment of withdrawal proceeds and loss of income and principal invested. This information is for general purposes only, should not be considered as a comprehensive statement on any matter and should not be relied upon as such. It has been prepared without taking into account any recipient's personal objectives, financial situation or needs. Because of this, recipients should, before acting on this information, consider its appropriateness having regard to their individual objectives, financial situation and needs. This information is not to be regarded as a securities recommendation. The information may contain material provided by third parties, is given in good faith and has been derived from sources believed to be accurate as at its issue date. While such material is published with necessary permission, and while all reasonable care has been taken to ensure that the information is complete and correct, to the maximum extent permitted by law neither PFSL nor any company in the Pendal group accepts any responsibility or liability for the accuracy or completeness of this information. Performance figures are calculated in accordance with the Financial Services Council (FSC) standards. Performance data (post-fee) assumes reinvestment of distributions and is calculated using exit prices, net of management costs. Performance data (pre-fee) is calculated by adding back management costs to the post-fee performance. Past performance is not a reliable indicator of future performance. Any projections are predictive only and should not be relied upon when making an investment decision or recommendation. Whilst we have used every effort to ensure that the assumptions on which the projections are based are reasonable, the projections may be based on incorrect assumptions or may not take into account known or unknown risks and uncertainties. The actual results may differ materially from these projections. For more information, please call Customer Relations on 1300 346 821 8am to 6pm (Sydney time) or visit our website www.pendalgroup.com |

24 Mar 2026 - Performance Report: Insync Global Quality Equity Fund
[Current Manager Report if available]

24 Mar 2026 - Australian Secure Capital Fund - Property Update
|
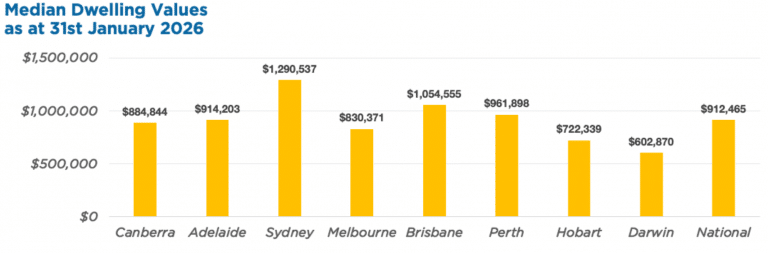
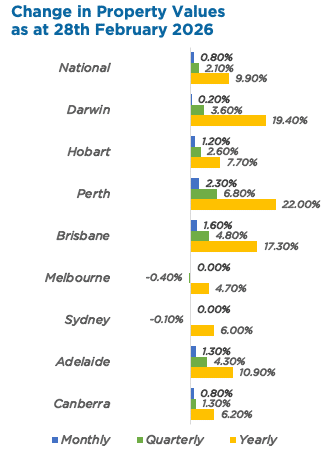
Australian Secure Capital Fund - Property Update Australian Secure Capital Fund March 2026 (1-minute read) February was another strong month for Australian property values, posting a national rise of 0.8% for the second consecutive month. Perth (+2.3%) again led the way with a second straight monthly rise of greater than 2%, adding more than $22,500 to the median dwelling value over the month. Similarly, Brisbane (+1.6%) and Adelaide (+1.3%) again saw monthly increases of greater than 1%. Conversely, values in Melbourne and Sydney were flat over February, with both cities notching slight rolling quarterly decreases of -0.4% and -0.1%, respectively. As a result, regional areas continue to outperform the capital cities, rising by 1.1% month-on-month, compared to 0.6% for the capitals. Nationally, rents increased 1.7% over the three months to February 2026, denoting the highest rolling quarterly increase since April 2025.
Source: Cotality HVI, 02 March 2026 February Edition Funds operated by this manager: ASCF Select Income Fund , ASCF High Yield Fund , ASCF Premium Capital Fund , ASCF Private Fund
|

23 Mar 2026 - Performance Report: Bennelong Twenty20 Australian Equities Fund
[Current Manager Report if available]

February due to reporting season, persistent AI disruption
fears and ongoing geopolitical tension. (2-minute read)
23 Mar 2026 - Glenmore Asset Management - Market Commentary
|
Market Commentary - February Glenmore Asset Management March 2026 (2-minute read) The volatility of the last few months was amplified in February due to reporting season, persistent AI disruption fears and ongoing geopolitical tensions. Domestically, large caps materially outperformed small/mid caps, resulting in the All Ordinaries Accumulation Index rising +3.3% compared to a -2.6% decline in the ASX Small Ordinaries Accumulation Index. The ASX50 had an extremely strong month, increasing by +7.9%, whilst at the smaller end, the Small Ords Industrials declined -4.5%. Capital light businesses, such as software and technology companies fell sharply due to investor fears around disruption from AI, whilst resources and mining services outperformed. In comparing the fund's performance versus the benchmark in February, it should be noted the fund has a strong small/mid cap focus. Over the long term, there is clear evidence that these companies deliver superior returns to large caps, however during periods of investor risk aversion (such as the current environment where the RBA is raising interest rates to combat inflation), investor funds typically move out of small caps to the perceived safety of large cap companies. In the US, the tech heavy NASDAQ was weighed down by similar factors, resulting in a -3.4% decline in the month, underperforming the S&P 500 which fell -0.9%. Outside of the US, the Euro Stoxx 50 and FTSE 100 maintained their recent momentum, rising +3.2% and +6.7%, respectively. As we have discussed, the expectation of further RBA rate hikes has continued to drive a rotation back into large caps. Bluechip names rebounded in February, including CBA (+17%), NAB (+13%), BHP (+16%) and Woolworths (+16%). Whilst the market continues to expect 1-2 more RBA rate hikes over the next 12 months, past cycles have shown that the underperformance of small/mid caps tends to bottom well before the end of a rate hiking cycle. In bond markets, the US 10-year bond yield recorded a sharp decline, falling -30 basis points (bp) to 3.94%, whilst its Australian counterpart fell -16bp to 4.65%. The Australian dollar continued to rise, increasing +2.2% to US$0.71, implying an increase of 1.5 cents. Funds operated by this manager: |

20 Mar 2026 - Hedge Clippings |20 March 2026
|
|
|
|
Hedge Clippings | 20 March 2026 It's been a volatile week for markets, interest rates, and above all, the politics of war. In Australia, the RBA raised rates for the second month in a row after cutting three times last year, including as recently as August. That suggests the Board may have moved too far, too soon on the way down, and there is now a real risk it may be jumping too quickly on the way back up. With inflation still stubborn and global uncertainty rising, and inflation with it, the RBA was clearly stuck between a rock and a hard place, which was reflected in the narrow 5-4 vote in favour of a hike. Hedge Clippings' experts Nick Chaplin and Renny Ellis, who argued against last year's cuts, were equally emphatic this week when we spoke to them that the Board could well have - and should have - held their nerve. With the next meeting only five or six weeks away, there was a strong case for waiting, and allowing February's increase more time to work through the economy, for February's inflation data to land, and for the fallout from the closure of the Strait of Hormuz -- and the likely duration of the conflict -- to become clearer. As Jerome Powell said after this week's Fed meeting when they kept rates steady, "we just don't know what comes next". Fair point. Right now, neither do markets, central banks, nor anyone trying to price risk with a straight face. And for that, investors can once again send a silent thank you (or maybe some other message) in Donald Trump's direction. News | Insights Expert Analysis of the RBA's March 17 Rate Decision | Seed Funds Management & Arculus Funds Management 10k Words | Equitable Investors February 2026 Performance News Bennelong Emerging Companies Fund Glenmore Australian Equities Fund Seed Funds Management Financial Income Fund Insync Global Capital Aware Fund |
|
|
If you'd like to receive Hedge Clippings direct to your inbox each Friday |

20 Mar 2026 - Performance Report: Cyan C3G Fund
[Current Manager Report if available]

20 Mar 2026 - Performance Report: Bennelong Long Short Equity Fund
[Current Manager Report if available]

20 Mar 2026 - Investment considerations of prolonged uncertainty over Iran
|
Investment considerations of prolonged uncertainty over Iran Janus Henderson Investors March 2026 (8-minute read) The conflict in the Middle East has escalated over the last few days and hopes for a short war have faded. Regional diplomatic efforts to de-escalate appear to be failing and Iran continues to retaliate in response to strikes from the US and Israel. As a result, the Strait of Hormuz - the world's most important gateway for energy commodities - remains effectively closed to all but the most buccaneering of shipping companies. The Strait closure is a result of a lack of insurance, firms not willing to risk the loss of future capacity if ships are sunk, and concerns for the welfare of sailors after several fatalities already. However, there are now risks of more intensive intervention from the US and/or Israel following reports that they are considering putting boots on the ground, either to try and extract Iranian enriched nuclear material or to take Kharg Island, a key sea terminal for Iranian oil exports. At the same time, a new Supreme Leader of Iran has been chosen who is seen as another hardliner. This is unlikely to be taken well by the US, who would have preferred someone more moderate, and the choice appears unlikely to create a path to de-escalation. The desired end point is still uncertainIt is still not immediately clear what the ultimate objectives for the US and Israel are. Various intentions have been publicly stated but it is not clear which of these are red lines and which are just preferences. A further reduction of the potential for Iran to build nuclear weapons appears to be the closest to a requisite. However, given that strikes in 2025 were deemed to have achieved this, defining the outcome is difficult. Similarly, a desire to destroy Iran's long-range missile program has been expressed, but this may similarly be difficult to guarantee. Finally, regime change, either for military or humanitarian reasons, is now touted as a key objective, but it remains unclear how this can be achieved with airstrikes alone. The objective mattersUnderstanding the motivating objectives is important when considering how long the war might last and the subsequent economic impact. We can look to several factors that suggest this could be a more prolonged campaign. Iran has indicated that it can continue with its current rate of response for six months, far longer than the weeks-long engagement that markets appeared to have been pricing. The US has expressed that it wishes to remove the previously enriched uranium that could be used in nuclear weapons, but it has been a long time since the last international inspection and its whereabouts are likely to be very uncertain. Similarly, the continuity of a new hardline leader suggests that Iran is feeling little pressure to change tack yet. However, there are also ways in which the conflict could be wound up sooner. The most obvious is that US President Trump has shown a willingness to abruptly change direction on policy multiple times throughout his leadership, no matter the scale of the impact. With mid-term elections coming up later in the year, the US government is likely to be highly sensitive to anything that pushes up the cost of living. Therefore, finding a way to declare victory and return oil prices to lower levels may ultimately dominate any longer-term military objectives. The length mattersA longer-term conflict raises the danger of greater destabilisation in the region, creates greater potential for more severe damage to key infrastructure and risks longer-lasting impact on energy supplies. While there are some ways to mitigate the impact in the near term, such as sending oil through pipelines to ports less likely to be targeted, or by releasing strategic reserves outside of the Middle East, these are either inherently temporary or lack the potential capacity to offset prolonged restrictions in the Strait of Hormuz. Oil is often seen as the key commodity when considering conflicts in the Middle East, given its relevance to US gasoline prices in particular, but natural gas supplies are crucial for other regions, such as Europe, and other base products feed into areas from chemicals to fertilisers. Last week, markets appeared to be pricing energy commodities in line with a short-term interruption to the ease of supply. Assumptions around this appear to have changed over the weekend, with prices now moving to incorporate greater risk of a prolonged engagement. The lack of clarity around the US/Israeli objectives does nothing to reduce the uncertainty that markets hate. Impact on marketsThe price of oil has spiked above US$100 per barrel as concerns about supplies have intensified. European natural gas prices have almost doubled since the end of February. This is raising the spectre of the inflationary impulse generated by the Russian invasion of Ukraine in early 2022 and the subsequent removal of much of the Russian supply into energy markets. Concerns about a jump in European inflation or simply prolonged stickiness in the US are lifting bond yields. US Treasury yields have moved higher as markets have taken out one of the US Federal Reserve interest rate cuts that were anticipated by the end of the year. Yields on 10-year Treasuries have seen less movement than their European counterparts, as US jobs numbers on Friday served to offset some upward yield pressure from expected inflation. Concerns about inflation have seen surges in German and UK breakeven rates, with market pricing for the European Central Bank interest rates at the end of 2026 now looking at over 1.5 hikes. Since the end of February, expectations for the Bank of England have shifted from two cuts by the end of 2026 to a better than 50:50 chance that there will be an interest rate hike - a marked shift in the outlook. Markets are now pricing in higher oil prices for the foreseeable future, with concerns mounting about a stagflationary outcome, should higher energy costs stall a re-acceleration in economic growth. The uncertainty has provided support for the much-maligned US dollar, given the American economy is looking better set to weather an energy shock than elsewhere. However, higher bond yields and a stronger greenback have dampened gold's ability to rally in the current environment, following strong performance during other recent periods of volatility. Equity markets are seeing something of a reversal of recent performance dynamics. Markets that started the year positively, to the end of February, suddenly look under greater pressure. A stronger dollar and higher oil prices are weighing on Asian stocks that had been surging in the first two months of the year. Gas prices remain Europe's geopolitical Achilles heel and markets are clearly concerned that the region is overly exposed again. In the US, last week saw some signs of a reversal of the recent outperformance of Value stocks over their Growth counterparts. AI-related stocks have struggled in 2026 so far compared to the rest of the market, but the fears that higher oil prices could dent the very rosy economic outlook are leading to something of a reconsideration. The effective closure of the Strait of Hormuz is unprecedented, undoubtedly making for severe impacts on risk assets. However, to put the sell-off in proper context, investors must also recognise that equities entered the conflict trading at a meaningful premium over historical valuation levels. The forward price/earnings ratios (P/Es) of major global equity markets were at top quartile levels versus their 20-year histories[1], roughly a 15%-30% premium compared to median levels. Indeed, the markets experiencing the largest sell-offs are the ones that entered the conflict with the highest returns year to date[2]. Risks of a prolonged war but don't rule out a quick "victory"Situations like this demonstrate the value of well-diversified multi-asset portfolios. Geopolitical events are rarely easy to gain complete clarity on, with the current US administration apparently embracing uncertainty as a negotiation strategy. What we can take away from the events of the last few days is that it is likely the conflict could last longer than many had initially hoped. This means there is the potential for greater economic impact - and markets have moved to price in this change. There is the potential for faster inflation and slower economic growth, with assets focusing on different aspects thus far. However, risks remain two-sided. US political pressures means that a quick "victory" should not be ruled out. Asset prices, driven by energy prices, are likely to swing violently as investors alter their expectations for either outcome. [1] Source: Datastream, 27 February 2026. Past performance does not predict future returns. [2] Source: Bloomberg, 31 December 2025 to 9 March 2026. Past performance does not predict future returns. |
|
Funds operated by this manager: Janus Henderson Australian Fixed Interest Fund , Janus Henderson Conservative Fixed Interest Fund , Janus Henderson Diversified Credit Fund , Janus Henderson Global Natural Resources Fund , Janus Henderson Tactical Income Fund , Janus Henderson Australian Fixed Interest Fund - Institutional , Janus Henderson Conservative Fixed Interest Fund - Institutional , Janus Henderson Cash Fund - Institutional , Janus Henderson Global Multi-Strategy Fund , Janus Henderson Global Sustainable Equity Fund , Janus Henderson Sustainable Credit Fund All opinions and estimates in this information are subject to change without notice and are the views of the author at the time of publication. Janus Henderson is not under any obligation to update this information to the extent that it is or becomes out of date or incorrect. The information herein shall not in any way constitute advice or an invitation to invest. It is solely for information purposes and subject to change without notice. This information does not purport to be a comprehensive statement or description of any markets or securities referred to within. Any references to individual securities do not constitute a securities recommendation. Past performance is not indicative of future performance. The value of an investment and the income from it can fall as well as rise and you may not get back the amount originally invested. Whilst Janus Henderson believe that the information is correct at the date of publication, no warranty or representation is given to this effect and no responsibility can be accepted by Janus Henderson to any end users for any action taken on the basis of this information. |