
NEWS

Datt Capital.
15 May 2026 - Manager Insights | Datt Capital
|
Chris Gosselin, CEO of FundMonitors.com, speaks with Emanuel Datt, founder and Chief Investment Officer at Datt Capital. Emanuel discussed recent market volatility, the divergence between large and small caps, and the opportunities emerging in the small companies space. He also discussed Datt Capital's approach to sector analysis, including technology, AI adoption, and energy, as well as the Fund's cash position and ability to act on market dislocations. Disclaimer: This conversation with FundMonitors was recorded prior to the release of the federal budget. |
|
|
Funds operated by this manager: Datt Capital Absolute Return Fund , Datt Capital Small Companies Fund |
|
|
|

14 May 2026 - It's the end of the world as we know it... and We Feel Fine.
|
It's the end of the world as we know it... and We Feel Fine. Revolution Asset Management April 2026 5-minute read |
|
Seeing the recent media headlines, one could be forgiven for thinking private credit is facing its end-of-the-world moment. The current media commentary has been dominated by rising default fears, valuation and redemption pressures, and warnings that the asset class is being tested for the first time in its modern form. The tone is urgent and unmistakably negative. This brings to mind the popular band, R.E.M.'s, 1987 release It's the End of the World as We Know It - a rapid fire sequence of alarming imagery that sounds like chaos unfolding in real time. However, as Michael Stipe (lead singer of R.E.M.) reminds us in the chorus... "I feel fine". The contrast reflects what Revolution Asset Management (Revolution) is experiencing in today's private credit market. While the noise and volatility are real and persistent, so too are disciplined deployment, conservative underwriting, a deliberate focus on non cyclical sectors, a refusal to chase yield (and risk), and experience driven portfolio construction which continues to underpin resilience. Why US Centric Developments Are Shaping Global Private Credit SentimentThere is no denying that parts of the global private credit market are under pressure. Much of the negative press is driven by developments in the U.S., where the asset class has grown rapidly over the past decade and where stress is now emerging in specific segments. This includes the so-called "SaaSpocalypse", redemption and liquidity pressures or rising default fears. In the U.S., private credit has had significant exposure to software and technology borrowers, alongside the widespread adoption of covenant lite structures that emerged during a prolonged period of strong inflows into the private credit segment. Additionally, general lending terms continued to weaken, and lenders were extending higher leverage, simultaneously. Over time, vulnerabilities that were already embedded in parts of the U.S. private credit market, such as higher opening leverage, aggressive EBITDA adjustments, covenant-lite structures and focusing on growth rather than cash flow generation were exposed, and some of those structures have now come under strain. Selective defaults, payment in kind interest, and amendments to loan terms have naturally attracted attention. As Mike Tyson once said: "Everybody has a plan until they get punched in the face". In the current environment, rapid deployment and relaxed processes work - until they don't. In this credit cycle, the consequences could be more severe, with recoveries potentially lower due to higher opening leverage and weaker underwriting standards. This narrative has been amplified by publicly traded vehicles. Share price volatility, widening discounts to net asset value, and a handful of high profile credit events have made for compelling headlines. But these headlines, by their nature, compress nuance and often extrapolate localised issues into broad conclusions about an entire asset class. The Reality: Dispersion, Not DeteriorationBeneath the surface, the private credit landscape is showing dispersion rather than systemic weakness. Performance outcomes are diverging based on underwriting standards, sector exposures, portfolio construction, and manager experience. Portfolios built with aggressive leverage assumptions, heavy exposure to smaller companies and cyclical earnings, or generally poor underwriting standards are more exposed to investor sentiment and market ructions. By contrast, private lenders that prioritised downside protection, with conservative structures, and focused on borrower cash flow stability are experiencing more stable outcomes. This is not unusual. Credit cycles have always been periods where discipline is revealed and rewarded. What about the "SaaSpocalypse"?SaaS (Software as a Service) companies that were previously considered market darlings, have also come under pressure as investors fear the potential impacts of AI disrupting traditional SaaS business models. For context, U.S. private credit portfolios and Business Development Companies typically contain quite material software and technology exposures (generally in the order of 20-30%). This compares to the single-digit-percentage of the Australian private credit market being in the software segment, with literally a handful of names, which are commonly referred to as "mission critical". Additionally, the concept of Annual Recurring Revenue, while foreign in Australia, is commonplace in the U.S., where private lenders provide funding based not on EBITDA and cash flow, but how fast their revenue is growing. As was recently outlined in the article: AI, Software, and Private Credit: Separating Credit Risk from Market Noise , not all software companies are created equally. This emphasised that the more well-known Australian mission-critical software providers have significant moats around their business in terms of the degree of embeddedness in their customer operations as well as already incorporating AI within their platforms to enhance their offering. Additionally, the Australian software companies in the private credit space are also considered platforms rather than applications, further adding to their embedded and more defensive nature. Set against Australia's more conservative lending framework and historically strong equity buffers, this means that while enterprise values may be lower than they were even a few months ago, a substantial layer of equity protection remains in place for senior lenders. In this structure, equity absorbs valuation pressure first, with credit impacts only emerging after a significant erosion of equity value. Why Private Credit Looks Different in Australia and New ZealandImportantly, Australia does not map neatly into the U.S. private credit narrative. Australian private credit has developed along a very different path, shaped by market structure, regulation, and borrower behaviour, with Australian private credit focusing more on conservative structures, asset backed strategies, and businesses with tangible cash flows.
For these reasons, applying U.S centric conclusions to Australian portfolios risks missing what matters on the ground. Stability through volatility, not dependent on optimismAgainst this backdrop, Revolution's portfolio positioning has been deliberate. Capital deployment has consistently prioritised credit discipline, with a focus on structure, security and borrower quality. Revolution has concentrated on non cyclical industries with stable demand drivers and resilient cash flows, diversified across the Australian and New Zealand private credit landscape, allowing the investment team to be selective and find the best relative value in markets they know well. Patient capital has also been a defining advantage through this period of volatility. By structuring funds with long�'dated capital and conservative liquidity settings, Revolution does not become a forced seller when markets dislocate. Instead, Revolution acts deliberately at moments when others cannot. As market volatility has increased, pockets of the private credit market have experienced liquidity�'driven selling, particularly from vehicles managing redemptions or facing near�'term funding constraints. These situations are rarely driven by a deterioration in underlying asset quality, but by the need to raise liquidity. For private credit managers with patient capital, this creates opportunity. The ability to acquire high�'quality loans, often at discounts, creates opportunities to deploy capital at more compelling risk�'adjusted returns. This dynamic reinforces why stability through volatility matters, not just defensively, but as a source of long�'term return generation. Revolution has encountered cycles like this before. Periods of rising interest rates, tightening liquidity, and heightened scrutiny are not new. What changes from cycle to cycle is who is prepared for them. Rather than viewing volatility as a signal to retreat, Revolution sees this as a natural phase of the credit cycle, one that reinforces the value of conservative underwriting, patience, and manager experience. Amid the market noise, discipline and resilience prevailsWhen R.E.M. sang It's the End of the World as We Know It, they weren't singing about ignoring risk or pretending chaos does not exist. It is about perspective. Amid the noise, there is a calm recognition that not everything unfolding is unexpected and not everything is catastrophic. The private credit landscape today is undergoing a healthy process of differentiation. Strong portfolios are distinguishing themselves from weaker ones. Structural discipline will be rewarded. And markets are once again reminding participants that credit is, ultimately, about risk management rather than return maximisation. While headlines may stay dramatic and volatility may persist, private credit lenders with resilient portfolios especially in markets like Australia and New Zealand, with materially different fundamentals to the U.S., remain well positioned. The world may sound like it is ending, but from where we sit, we feel fine. |
|
Funds operated by this manager: Revolution Private Debt Fund II , Revolution Wholesale Private Debt Fund II - Class B Important Information This information is for wholesale and professional investors only and has been prepared by Revolution Asset Management Pty Ltd ACN 623 140 607 AFSL 507353 ('Revolution'). Channel Investment Management Limited ACN 163 234 240 AFSL 439007 ('CIML') is the trustee and issuer of units for the Revolution Private Debt Fund II, Revolution Wholesale Private Debt Fund II (collectively 'the Funds'). Channel Capital Pty Ltd ACN 162 591 568 AR No. 001274413 ('Channel') provides investment infrastructure and distribution services for Revolution and is the holding company of CIML. FundRock NZ Limited is the issuer of units in the Revolution Private Debt PIE Fund (NZD) (the 'NZ Fund'). Public Trust is the independent trustee of the Scheme of the NZ Fund. Revolution is the appointed Investment Manager for the NZ Fund. Refer to fundrock.com/fundrock-new-zealand for more information. The NZ Fund is intended for the exclusive use of wholesale investors, as defined by the Financial Markets Conduct Act 2013. This information is supplied on the following conditions which are expressly accepted and agreed to by each interested party ('Recipient'). This information contains general financial product advice only and has been prepared without taking into account the objectives, financial situation or needs of any particular person. It is intended solely for wholesale clients (including sophisticated investors) as defined under sections 761G and 761GA of the Corporations Act 2001 (Cth). Revolution is not licensed in Australia to provide financial product advice or other financial services to retail investors. The information provided should not be considered personal advice, a recommendation, or an offer to invest in the Funds. Recipients should not rely on this information in making investment decisions. A Recipient should, before making any investment decisions, consider the appropriateness of the information, and seek professional advice. Neither Revolution, Channel, CIML, FundRock NZ Limited or their representatives and respective employees or officers (collectively, 'the Beneficiaries') make any representation or warranty, express or implied, as to accuracy, reliability or completeness of this information or subsequently provided to the Recipient or its advisers by any of the Beneficiaries, including, without limitation, any historical financial information, the estimates and projections and any other financial information derived there from, and nothing contained in this information is, or shall be relied upon, as a promise or representation, whether as to the past or the future. All investments contain risk. Past performance is not a reliable indicator of future performance. For further information and before investing, please read the Information Memorandum available on request. |

Markets don't wait for certainty. They reprice the expectation. (4-minute read)
13 May 2026 - When the Map Changes Mid-Journey
|
When the Map Changes Mid-Journey Alphinity Investment Management April 2026 4-minute read |
|
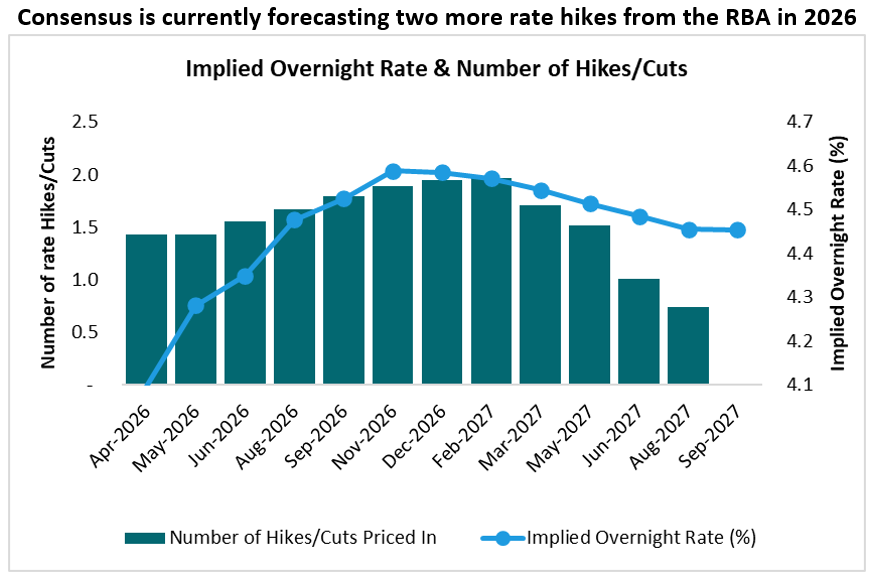
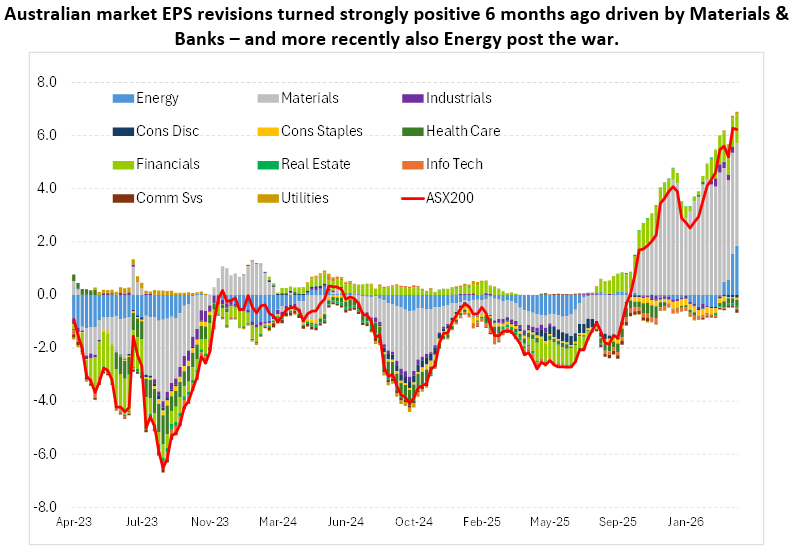
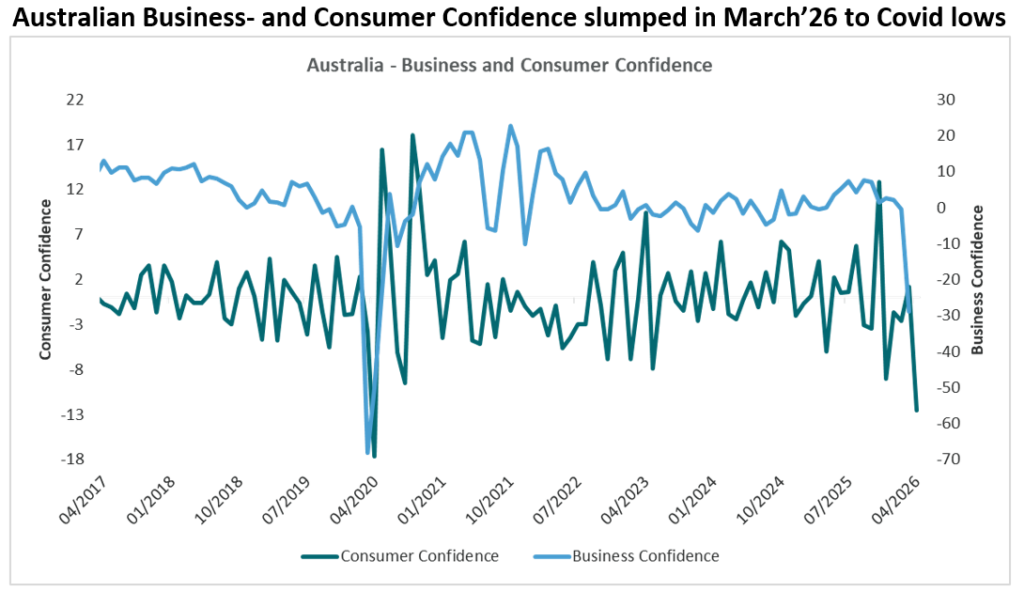
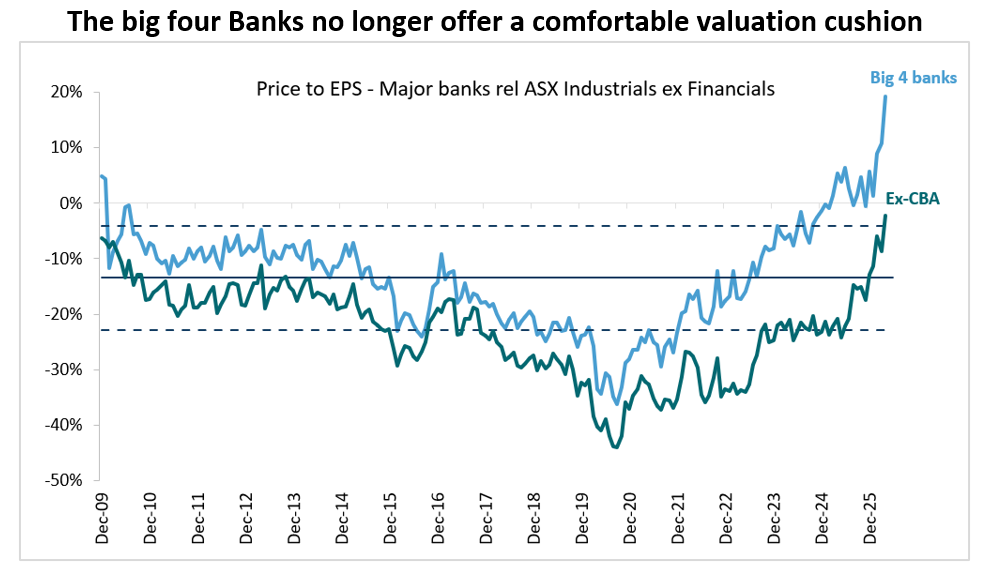
The macro has taken over. Here's how we're navigating it Markets don't wait for certainty. They reprice the expectation. After a strong run into February 2026, led by Materials and Banks, two of the most economically sensitive corners of the Australian market, the landscape has shifted quickly. The Middle East conflict has moved markets from micro to macro almost overnight, raising a familiar and uncomfortable question: what happens to growth from here? The Australian backdrop is more complicated than most Australia entered this period with a problem most markets didn't have to the same extent: a persistent lift in underlying inflation that had already forced the RBA's hand. Two rate rises into a new cycle, and central bank credibility was already being tested. Consumer confidence had begun to wobble, and spending was pulling back even before the uncertainty and inflation caused by the war was a risk.
Source: Bloomberg, 21 April 2026 What we're watching Earnings. Full stop.
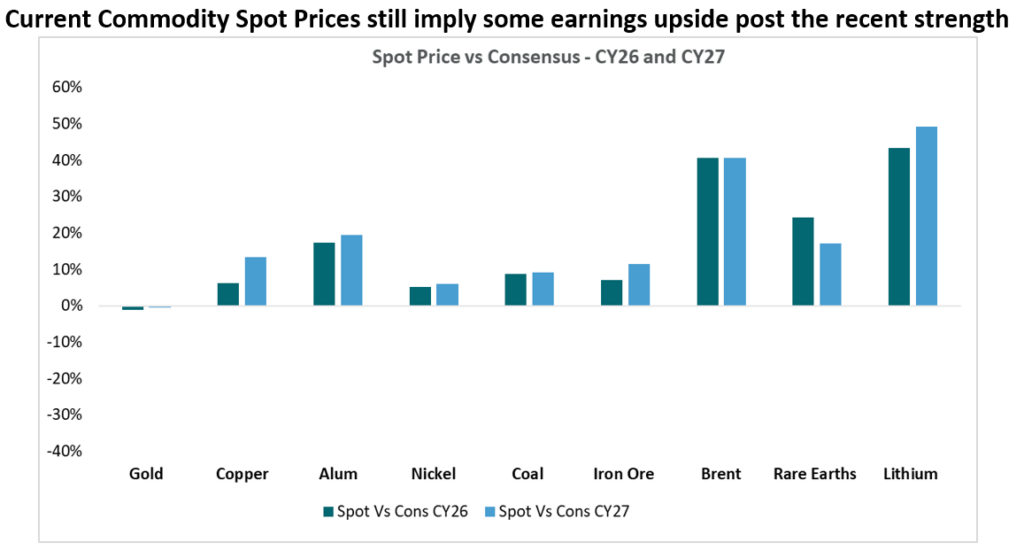
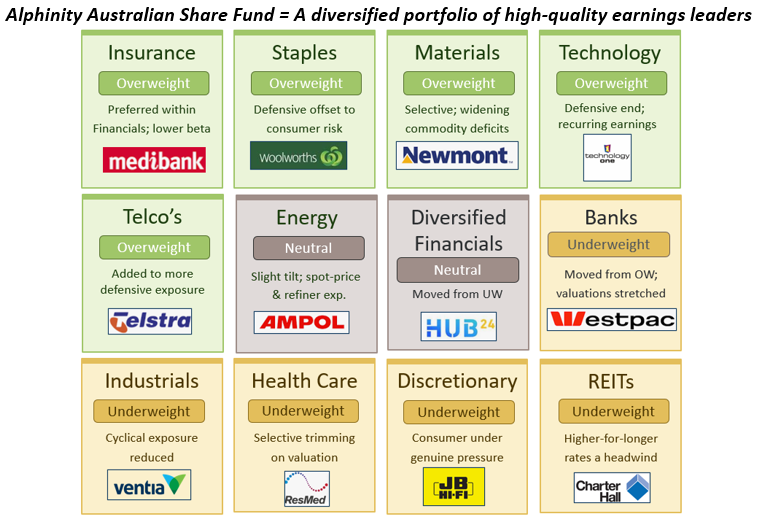
Source: UBS, 31 March 2026 How the portfolio is positioned With genuine uncertainty elevated, this is not the environment for bold, concentrated bets. Instead, we've been making deliberate, measured tilts -- reducing exposure to emerging risks and adding to areas with more resilient earnings
Source: Alphinity, Bloomberg, 21 April 2026
Source: Bloomberg, 21 April 2026
Source: Barrenjoey, Alphinity, 31 March 2026 The bottom line This is an autumn for patience. The macro uncertainty is real, and we won't pretend otherwise. But uncertainty is not the same as paralysis -- it's an invitation to think carefully about where earnings are genuinely supported and where they are not.
Source: Alphinity, 20 April 2026 |
|
Funds operated by this manager: Alphinity Australian Share Fund , Alphinity Concentrated Australian Share Fund , Alphinity Sustainable Share Fund , Alphinity Global Equity Fund , Alphinity Global Sustainable Equity Fund This material has been prepared by Alphinity Investment Management ABN 12 140 833 709 AFSL 356 895 (Alphinity). It is general information only and is not intended to provide you with financial advice or take into account your objectives, financial situation or needs. To the extent permitted by law, no liability is accepted for any loss or damage as a result of any reliance on this information. Any projections are based on assumptions which we believe are reasonable but are subject to change and should not be relied upon. Past performance is not a reliable indicator of future performance. Neither any particular rate of return nor capital invested are guaranteed. |

12 May 2026 - Prediction Markets: The next big disruption in investing?

11 May 2026 - 10k Words | April 2026
|
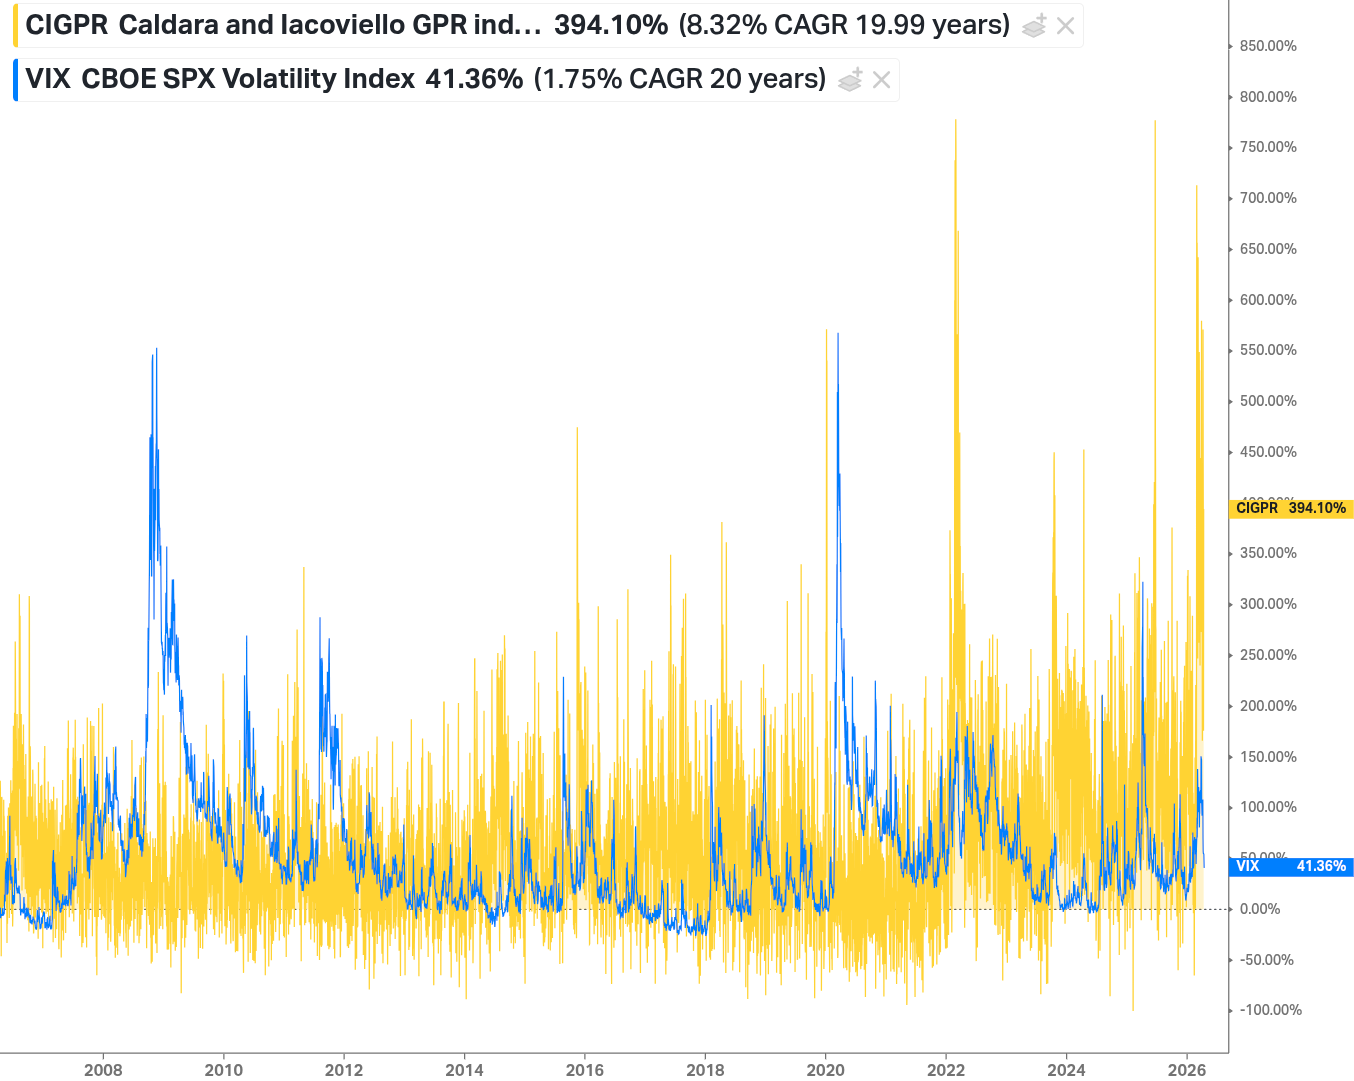
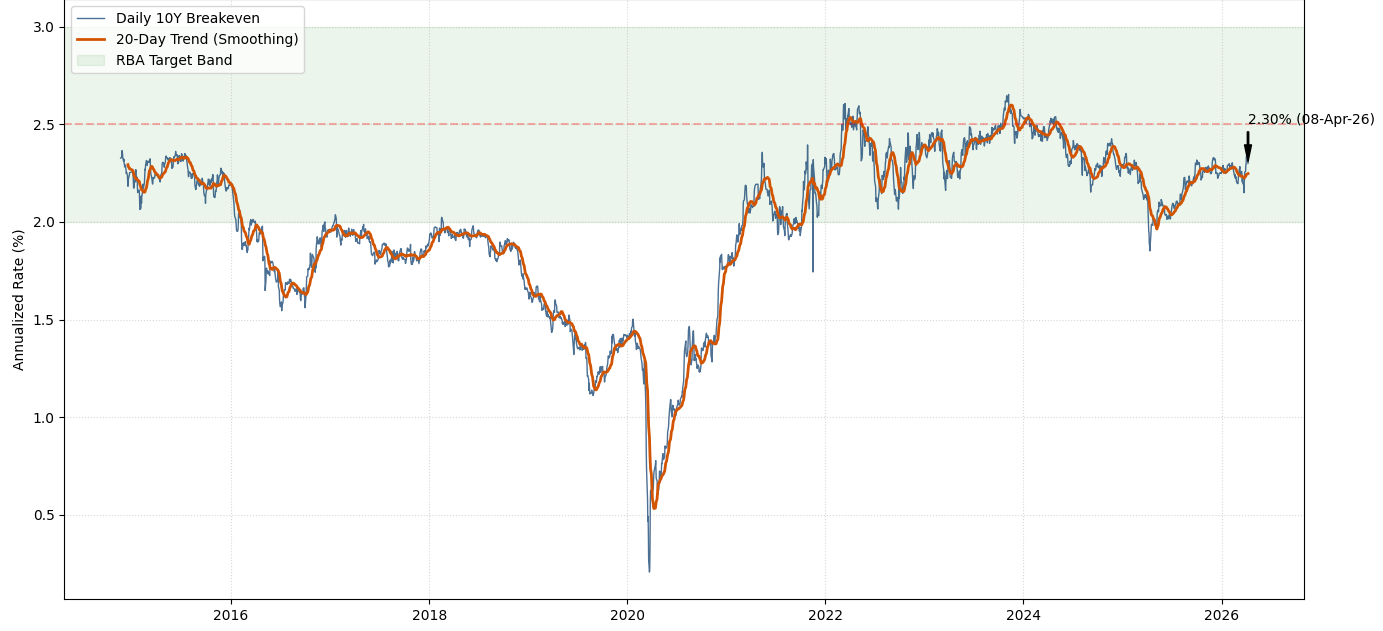
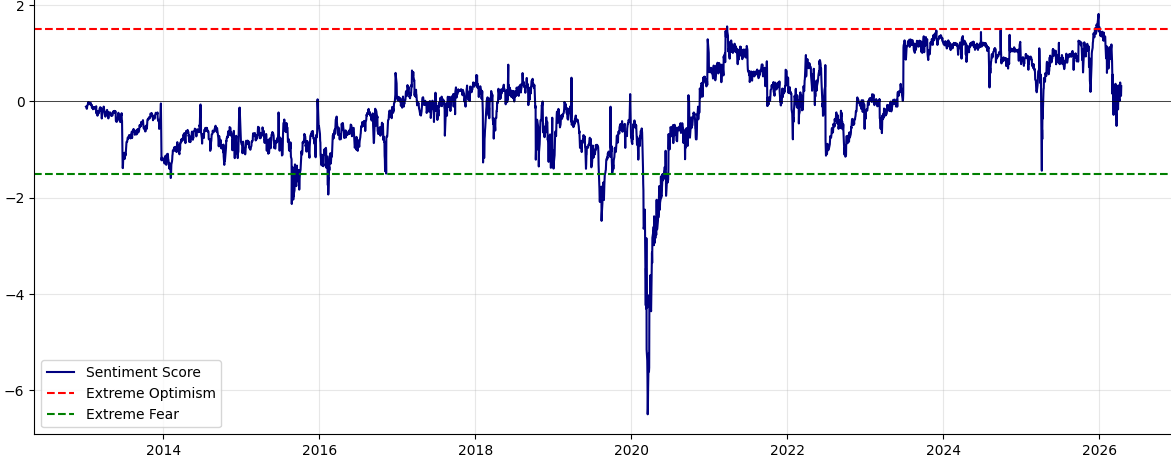
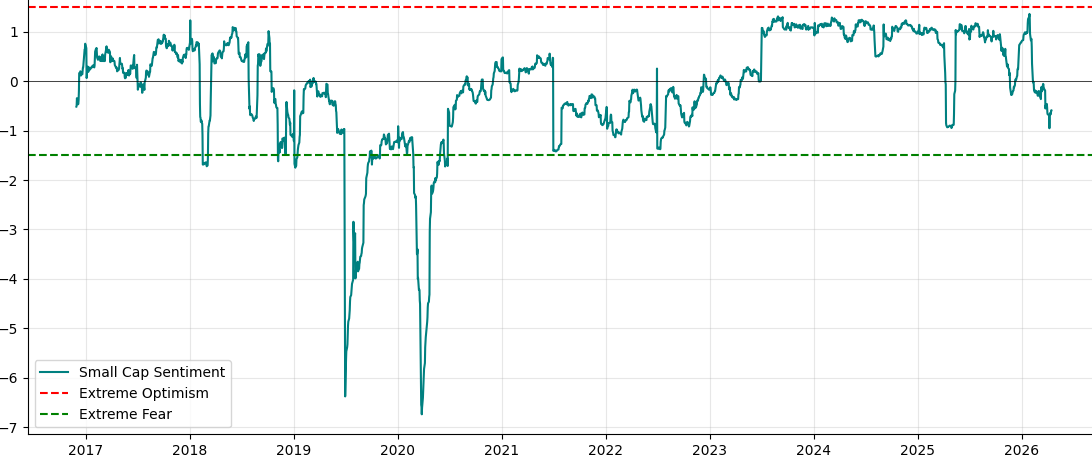
10k Words Equitable Investors April 2026 (2-minute read) We couldn't help but look at geopolitical risk again - with the spike in a longer historical context than shown last month. Fertiliser prices are spiking in the wake of the Middle East situation. Yet the "breakeven" inflation rate based on Australian 10-year bonds remains at a relatively normal level, implying short term shocks are expected to have modest long-term ramifications. Our sentiment scores show ASX large cap sentiment rebounding but small caps trailing. The US experience has shown a large cap rebound of rare magnitude in recent days. Meanwhile, we talk about index concentration in the stock market but take a look at recent concentration in the world of venture capital. We divert to the recently-depressed valuation metrics for the tech sector. Then on to redemptions at leading private credit house Blue Owl Capital. Finally, energy consumption and income go hand-in-hand and we take a look at Australia's national debt stack. Geopolitical Risk Index relative performance to VIX (US volatility) over 20 years
Source: Caldara and Iacoviello, Koyfin Fertiliser price spikes and war
Source: Bloomberg Aus 10-year bond yield-derived breakeven inflation rate: 2014 to Apr 2026
ASX sentiment score (yield spread + VIX)
Source: St Louis Fed, Equitable Investors ASX small cap sentiment score
Source: Koyfin S&P 500 rallying 9.8% in 10-days - the 99.7th percentile of all 10 day returns
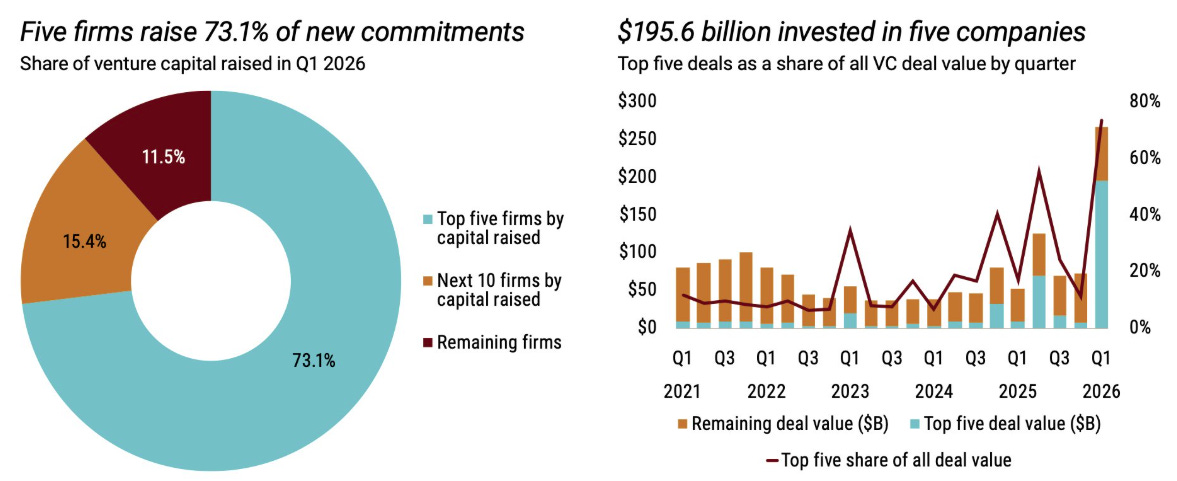
Source: 3Fourteen Research ~75% of all VC funds raised by just five firms & invested in five companies
Source: Pitchbook NVCA Venture Monitor, as of March 31, 2026 US tech sector PEG ratio (historical earnings growth)
Source: Goldman Sachs Global Investment Research Average EV/Revenue multiple (next 12 months revenue forecast) for Software industry
Source: Apollo, Illiquid Insights Blue Owl quarterly redemption requests as a % of shares outstanding
Source: Global Markets Investor US leveraged loan defaults: trailing 12-month count
Electricity & Income (per capita)
Source: EIEA, World Bank, @JoeNakamato National gross debt of Australia
Source: IFM Investors Funds operated by this manager: Equitable Investors Dragonfly Fund Disclaimer Past performance is not a reliable indicator of future performance. Fund returns are quoted net of all fees, expenses and accrued performance fees. Delivery of this report to a recipient should not be relied on as a representation that there has been no change since the preparation date in the affairs or financial condition of the Fund or the Trustee; or that the information contained in this report remains accurate or complete at any time after the preparation date. Equitable Investors Pty Ltd (EI) does not guarantee or make any representation or warranty as to the accuracy or completeness of the information in this report. To the extent permitted by law, EI disclaims all liability that may otherwise arise due to any information in this report being inaccurate or information being omitted. This report does not take into account the particular investment objectives, financial situation and needs of potential investors. Before making a decision to invest in the Fund the recipient should obtain professional advice. This report does not purport to contain all the information that the recipient may require to evaluate a possible investment in the Fund. The recipient should conduct their own independent analysis of the Fund and refer to the current Information Memorandum, which is available from EI. |


6 May 2026 - Stock Story: Ampol
|
Stock Story: Ampol Airlie Funds Management April 2026 (5-minute read) |
|
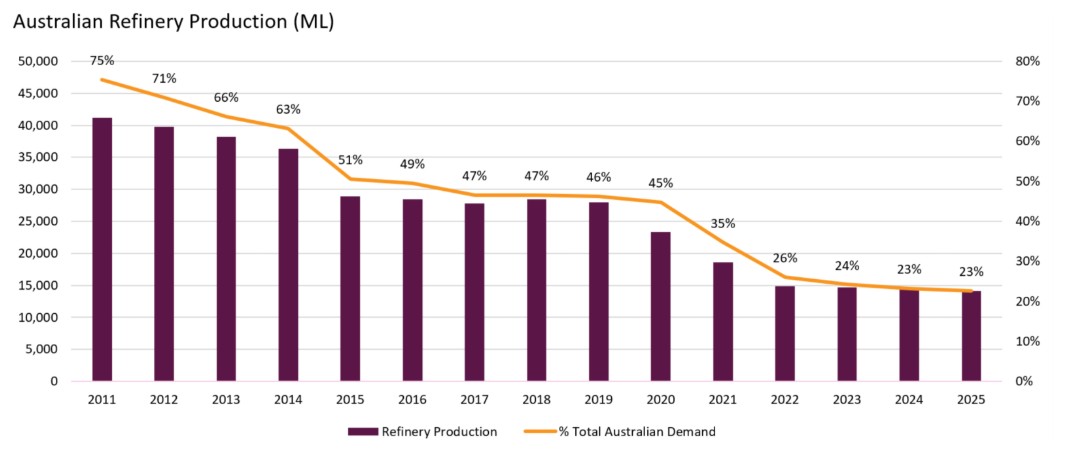
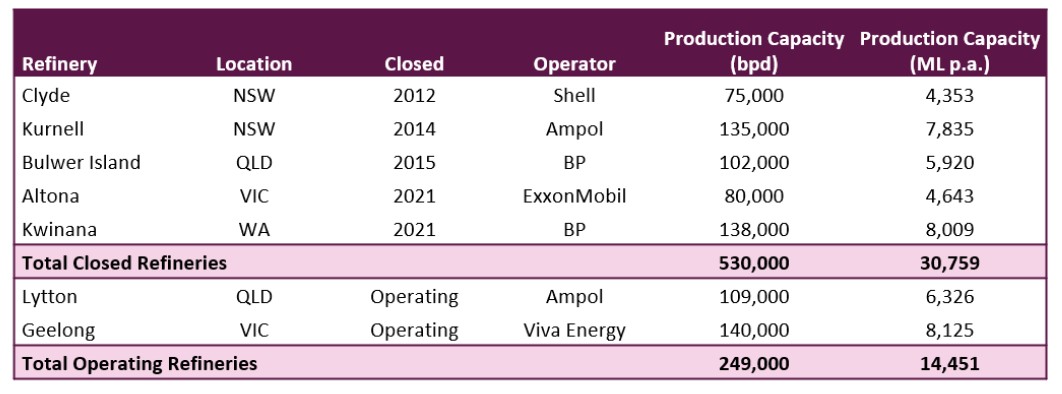
Pathway to unlocking value outside the headlines. Ampol is Australia's largest fuel refiner and distributor, playing a critical role in supplying fuel to Australian consumers and industries. While Ampol is widely recognised for its national convenience retail network, we believe the market underappreciates the strategic value of their Lytton refinery asset. Lytton is one of only two remaining refineries in Australia. While the recent Iran conflict has drawn attention to the importance of fuel security in Australia, we see the real catalyst for value realisation sitting not in the headlines themselves, but in the evolving policy discussions that underpin Lytton's long-term earnings. Australia's refining capacity has deteriorated dramatically over the past 15 years. In 2011, the country operated seven refineries, supplying around 75% of domestic fuel demand. Today, only two refineries remain, these being Ampol's Lytton Refinery in Brisbane and Viva Energy's Geelong Refinery. Combined, these refineries meet just 20% of Australia's fuel needs. The balance of fuel is imported as refined product, predominantly from South Korea, Singapore, Malaysia, China and Japan. As Australia has shifted from refining self-sufficiency to import dependence, the strategic value of these last two refineries has grown considerably, given their role in national fuel security.
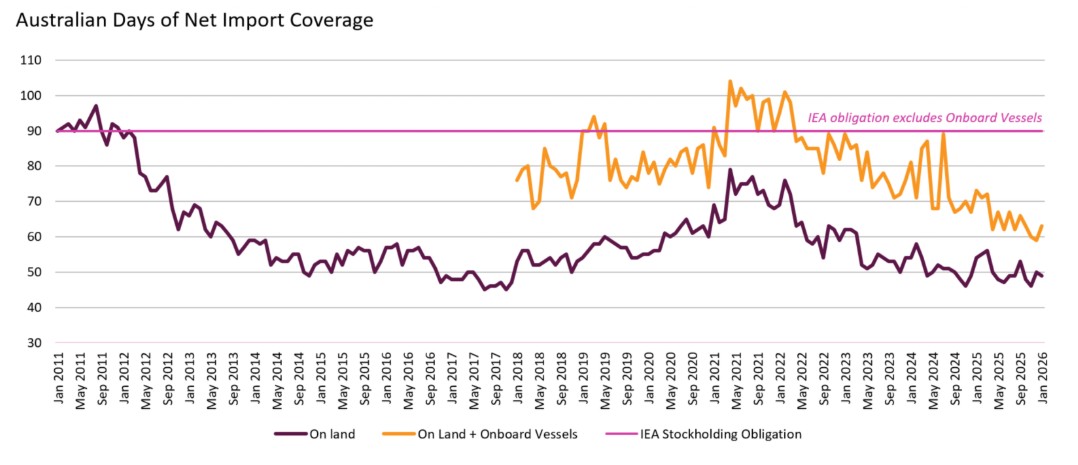
The outbreak of the war against Iran and subsequent closure of the Strait of Hormuz triggered a major global supply disruption. Notably, Ampol does not use Middle Eastern crude oil, yet the cascading effects on Asian refining production and product flows still materially affected supply chains into Australia. With Australia's fuel stockholdings well below the IEA's 90-day requirement, concerns around supply security were heightened.
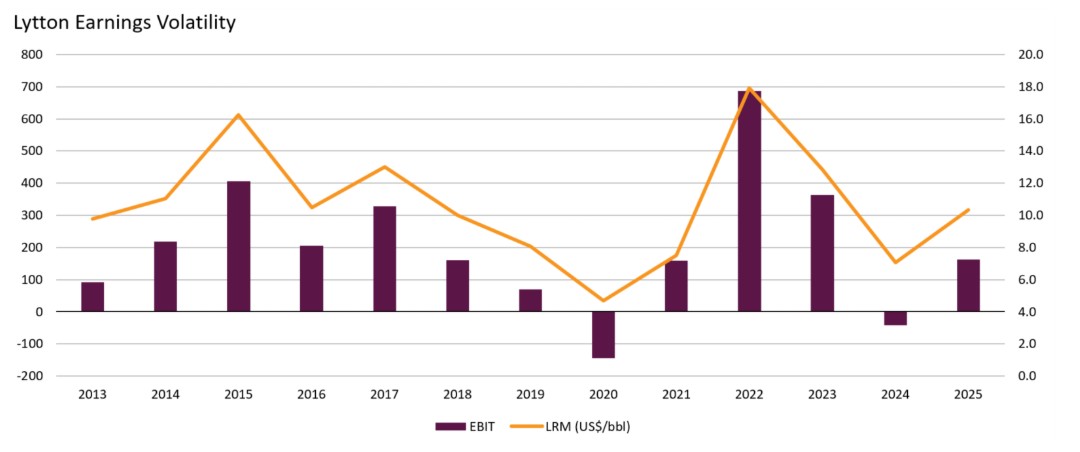
Ampol is Australia's largest fuel refiner and distributor, playing a critical role in supplying fuel to Australian consumers and industries. While Ampol is widely recognised for its national convenience retail network, we believe the market underappreciates the strategic value of their Lytton refinery asset. Lytton is one of only two remaining refineries in Australia. While the recent Iran conflict has drawn attention to the importance of fuel security in Australia, we see the real catalyst for value realisation sitting not in the headlines themselves, but in the evolving policy discussions that underpin Lytton's long-term earnings. Australia's refining capacity has deteriorated dramatically over the past 15 years. In 2011, the country operated seven refineries, supplying around 75% of domestic fuel demand. Today, only two refineries remain, these being Ampol's Lytton Refinery in Brisbane and Viva Energy's Geelong Refinery. Combined, these refineries meet just 20% of Australia's fuel needs. The balance of fuel is imported as refined product, predominantly from South Korea, Singapore, Malaysia, China and Japan. As Australia has shifted from refining self-sufficiency to import dependence, the strategic value of these last two refineries has grown considerably, given their role in national fuel security. On a regulated basis, we estimate Lytton's value at $1.5-2.0 billion, compared to our estimate of the market's current implied valuation of less than $1.0 billion. This gap implies $3-$5 per share of incremental value to Ampol's current share price from the Lytton re-rate alone, before considering further upside from the EG Group acquisition and the rollout of U-GO conversions across the convenience retail network.
Funds operated by this manager: Airlie Australian Share Fund , Airlie Small Companies Fund Important Information: This material has been delivered to you by Magellan Asset Management Limited ABN 31 120 593 946 AFS Licence No. 304 301 trading as Airlie Funds Management ('Airlie') and has been prepared for general information purposes only and must not be construed as investment advice or as an investment recommendation. This material does not take into account your investment objectives, financial situation or particular needs. This material does not constitute an offer or inducement to engage in an investment activity nor does it form part of any offer documentation, offer or invitation to purchase, sell or subscribe for interests in any type of investment product or service. You should obtain and consider the relevant Product Disclosure Statement ('PDS') and Target Market Determination ('TMD') and consider obtaining professional investment advice tailored to your specific circumstances before making a decision about whether to acquire, or continue to hold, the relevant financial product. A copy of the relevant PDS and TMD relating to an Airlie financial product or service may be obtained by calling +61 2 9235 4760 or by visiting www.airliefundsmanagement.com.au. Past performance is not necessarily indicative of future results and no person guarantees the future performance of any financial product or service, the amount or timing of any return from it, that asset allocations will be met, that it will be able to implement its investment strategy or that its investment objectives will be achieved. This material may contain 'forward-looking statements'. Actual events or results or the actual performance of an Airlie financial product or service may differ materially from those reflected or contemplated in such forward-looking statements. This material may include data, research and other information from third party sources. Airlie makes no guarantee that such information is accurate, complete or timely and does not provide any warranties regarding results obtained from its use. This information is subject to change at any time and no person has any responsibility to update any of the information provided in this material. Statements contained in this material that are not historical facts are based on current expectations, estimates, projections, opinions and beliefs of Airlie. Such statements involve known and unknown risks, uncertainties and other factors, and undue reliance should not be placed thereon. No representation or warranty is made with respect to the accuracy or completeness of any of the information contained in this material. Airlie will not be responsible or liable for any losses arising from your use or reliance upon any part of the information contained in this material. Any third party trademarks contained herein are the property of their respective owners and Airlie claims no ownership in, nor any affiliation with, such trademarks. Any third party trademarks that appear in this material are used for information purposes and only to identify the company names or brands of their respective owners. No affiliation, sponsorship or endorsement should be inferred from the use of these trademarks. This material and the information contained within it may not be reproduced, or disclosed, in whole or in part, without the prior written consent of Airlie. |

5 May 2026 - Australian Secure Capital Fund - Property Update
|
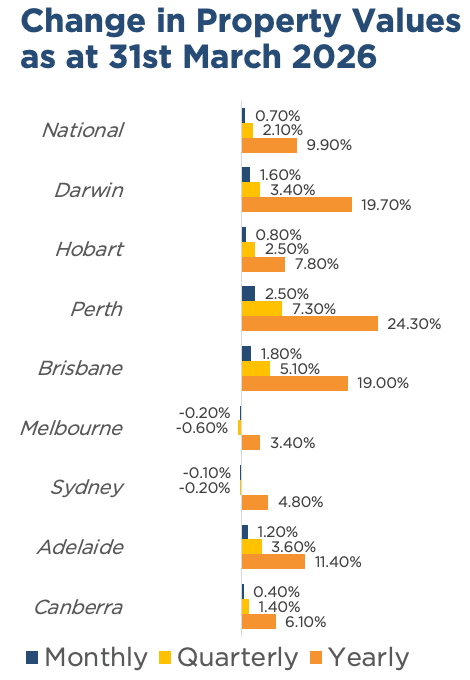
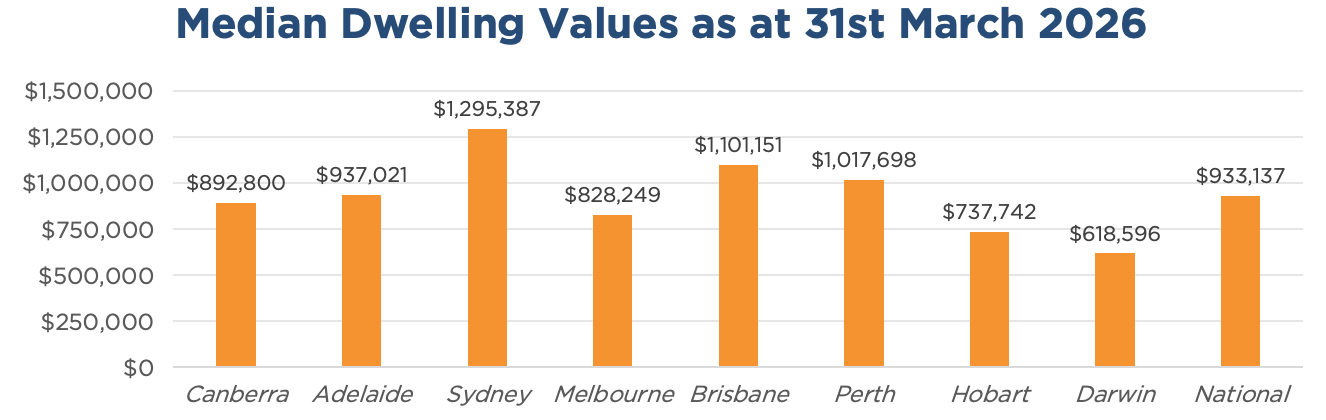
Australian Secure Capital Fund - Property Update Australian Secure Capital Fund March 2026 (1-minute read) March was another steady month for Australian property values, posting a national rise of 0.7%, down slightly from 0.8% in February.
Once again, Perth (+2.5%) led the way with a third consecutive monthly rise of greater than 2%, with the annual increase now reaching 24.3%. Likewise, Brisbane (+1.8%) and Adelaide (+1.2%) continued to add value, again posting monthly increases of greater than 1%. Conversely, values in Melbourne (-0.2%) and Sydney (-0.1%) declined for a second straight month, with the cities notching rolling quarterly declines of -0.6% and -0.2%, respectively. Due to this, regional areas (+1.1%) continue to outpace the capitals (+0.6%) by nearly double, with regional WA leading the way, posting a 6.2% quarterly increase.
Source: Cotality HVI, 02 April 2026 March Edition Funds operated by this manager: ASCF Select Income Fund , ASCF High Yield Fund , ASCF Premium Capital Fund , ASCF Private Fund
|

4 May 2026 - Manager Insights | Altor Capital
|
Chris Gosselin, CEO of FundMonitors.com, speaks with Benjamin Harrison, Chief Investment Officer at Altor Capital. In this conversation, Ben shared how the Altor AltFi Income Fund has delivered consistent performance over seven years, combining private credit investments with unique equity kickers. He also discussed their hands-on approach, focus on mid-market corporates, and where he sees the greatest opportunities for growth-making this a valuable watch for investors interested in private credit. |
|||
|
|||
|
|
|||

1 May 2026 - Expert analysis on what the RBA will do next Tuesday, May 5
|
Expert analysis on what the RBA will do next Tuesday, May 5 FundMonitors.com May 2026 |
|
Chris Gosselin, CEO of FundMonitors.com, speaks with Nicholas Chaplin, Director and Portfolio Manager at Seed Funds Management, and Renny Ellis, Director & Head of Portfolio Management at Arculus Funds Management. The discussion centres on Australia's latest inflation figures and whether the RBA should hold rates steady ahead of the federal budget. Nick and Renny broadly agree the central bank should wait for more data, while weighing the risks that temporary inflation pressures from energy and geopolitical uncertainty could become more persistent. |

29 Apr 2026 - A decade of delivery: infrastructure's changing world
|
A decade of delivery: infrastructure's changing world 4D Infrastructure April 2026 (10-minute read) The 4D Global Infrastructure Fund (Unhedged) recently passed its tenth anniversary, delivering annualised returns of over 10% since inception[1]. Global Portfolio Manager Sarah Shaw reflects on what's changed in the infrastructure world over that decade, what the next chapters look like, and why the core investment case remains as compelling as ever. What's changed over the past ten years The investment universe has grown -- and matured When we launched the Fund in 2016, the global listed infrastructure universe was narrower and less sophisticated than it is today. The pool of investable companies has expanded substantially, as sub-sectors and individual companies have repositioned themselves to capitalise on the structural characteristics that define quality infrastructure: underpinned by contract or regulation, earnings visibility and long asset lives. Market capitalisation across the asset class has grown at a compound annual growth rate (CAGR) of approximately 10% since the late 1990s[2], and the number of specialist global infrastructure managers has grown from a handful to more than 60.[3] The asset class is better understood, better researched, and more institutionally accepted than it was a decade ago. The demand for infrastructure investment has become structurally larger Ten years ago, three core investment growth themes were gaining traction: the catch up from chronic under-investment in developed market infrastructure, global population growth, and the rise of the emerging middle class. Each remains significant today, but two additional themes have since emerged with a scale that few anticipated. The first is energy transition. The decarbonisation of the global economy requires an unprecedented build-out of cleaner generation, networks/grids (transmission & distribution), and storage capacity. The International Energy Agency (IEA) estimates that annual global clean energy investment, which was $1.5 trillion in 2022 and $2.2 trillion in 2025, needs to reach $3.5 trillion annually by 2030 and over $4.5 trillion by 2046. This isn't a short-term investment cycle - it's a multi-decade structural opportunity. The second is AI and its insatiable demand for electricity, abundant water and digital infrastructure. The major hyperscalers are forecast to collectively deploy more than USD 600 billion in capital expenditure in 2026 alone[4], with the vast majority directed at data centre expansion and AI compute infrastructure. Global data centre electricity demand is projected to more than double by 2030, reaching nearly 1,000 TWh. This is roughly equivalent to Japan's entire annual electricity consumption.[5] The infrastructure that carries, stores, and powers the digital economy - fibre, towers, substations, and transmission grids - is being recognised as the critical backbone it is. Taking the full picture together - energy transition, digital transformation, population growth, replacement of ageing developed-market assets, and the emergence of the middle class - the McKinsey Global Institute estimates that over USD 100 trillion of global infrastructure investment is needed through to 2040 (~USD 7 trillion per annum). The world is not close to spending at that rate.[6] That gap between need and delivery is the opportunity and critically this investment must happen regardless of geopolitics, trade wars, wars, or economic cycles. Geopolitical complexity has intensified Managing country and political risk has always been central to 4D's investment process. Over the past decade, that discipline has been tested by Brexit, a global pandemic and related fallout, the Russia-Ukraine conflict and its impact on energy markets, China's property sector stress and longer-term demographic pressures, the resurgence of resource nationalism, and more recently the Middle East conflict. Infrastructure assets sit at the intersection of economics and politics and understanding the regulatory and sovereign environment in which each asset operates is, in our view, non-negotiable for a disciplined global approach. Sustainability has evolved from environmental screening to systemic integration A decade ago, ESG in infrastructure was largely synonymous with carbon footprint and environmental compliance. The conversation has since broadened substantially. Gas and nuclear were written off under early green mandates but have undergone a significant re-evaluation as policymakers grappled with the realities of energy security and transition sequencing. Responsible investment is now respected as a system-level discipline, encompassing social licence, regulatory relationships, community resilience, and governance quality. 4D's country-level ESG analysis, integrated into our bottom-up stock selection, has always reflected this more complete picture. Physical climate risk is now a core investment variable The increasing frequency and severity of weather events such as floods, wildfires and extreme temperatures directly affect the value and viability of infrastructure assets. Our analysis now incorporates asset-level climate exposure as a material risk consideration, not a secondary one. What will change Looking ahead, we expect at least six forces to continue to shape the infrastructure universe over the next decade. The energy transition will continue to drive substantial investment needs While the speed of ultimate decarbonisation remains unclear, there appears to be a real opportunity for multi-decade investment as every country moves towards a cleaner environment. Energy transition and decarbonisation of the power sector is an obvious thematic and is expected to have the greatest impact on countries looking for Net Zero. However, it is not just the energy sector with other forms of infrastructure, namely transportation and technology, also having a key role to play. There will be no Net Zero without significant new infrastructure spend. The 2022 energy crisis across Europe highlighted that this transition must be managed in a socially responsible way with security of supply a priority. This realisation has fast-tracked the build of new renewables sources, increased investment in grids to enable its distribution to end users and reaffirmed the importance of transition fuels such as gas in the shift. Electricity demand linked to AI will rise sharply AI and data centres are the defining technological story of this decade. And data centres are, fundamentally, an infrastructure demand story. They require enormous amounts of secure base-load energy -- preferably green -- and an abundance of water for cooling. IEA projects that data centres will drive more than 20% of electricity demand growth in advanced economies to 2030, and in the US, data centres could account for almost half of the growth in electricity demand between now and 2030. Further to this, data centres, fibre networks, subsea cables, and satellite systems are increasingly being treated by governments as strategic infrastructure assets. We expect this will accelerate regulatory framework development and investors will need to navigate a more complex approval and operating environment for digital assets, particularly in geopolitically sensitive jurisdictions. Emerging markets will become an increasingly active part of the opportunity set Emerging market (EM) economies are expected to grow rapidly over the next 30 years, altering the current world economic order which has been in place for much of the post-WWII era. This growth will be driven by an evolving middle class. Given the potential size of the middle class in EMs (which make up over 85% of the global population) changes in spending and consumption patterns will have significant implications for global business opportunities and infrastructure investment for decades to come. The infrastructure investment need in these regions is huge. For example, EMs currently have one-third of the energy consumption per capita of the developed world. As incomes rise, that gap closes -- and the infrastructure to support it must continue to be built with over two thirds of the forecast clean energy investment needed in the emerging world. As governance frameworks mature and institutional capital deepens in key markets, we expect the investable EM infrastructure universe to expand, and for active managers with dedicated and experienced analytical capability to be well positioned to capture that opportunity. Water security is the underappreciated dimension of the investment imperative Chronic underinvestment in ageing water networks across developed markets -- where pipe replacement cycles routinely run decades behind schedule and leakage rates in some systems exceed 30% of total supply -- is creating a huge capital deployment opportunity. In the emerging world, the imperative is more acute still: more than two billion people lack access to safely managed drinking water, and the UN's Sustainable Development Goal 6 -- universal access to clean water and sanitation by 2030 -- is materially off track, redirecting political will and multilateral capital toward the sector. The convergence of climate stress such as droughts, floods, and rising water scarcity is intensifying the physical risk to water assets and the cost of inaction. And the AI theme compounds the need for secure water sources as it is essential for cooling. Water infrastructure is transitioning from an afterthought in infrastructure portfolios to an important opportunity. Deglobalisation will reshape transport, logistics, and industrial infrastructure The fragmentation of global supply chains - driven by geopolitical tensions, economic nationalism, and the strategic imperative for greater self-sufficiency - is redirecting trade flows and creating new infrastructure investment requirements that did not exist a decade ago.[7] The reshoring of manufacturing to the US, Europe, and strategic allies is generating demand for industrial facilities, regional logistics networks, port upgrades, and rail and road connections that support new trade corridors. This, coupled with increasing desire for energy independence, is driving even more demand for domestic energy infrastructure. For infrastructure investors, this represents a structural shift in the composition of the investable universe and underscores the importance of active, geopolitically-informed portfolio management. Defence and security spending will drive a new wave of dual-use infrastructure Governments across Europe, Asia-Pacific, and North America are materially increasing defence budgets in response to a more fractured global security environment. EU member states spent €343 billion on defence in 2024, a 19% increase year-on-year, with further increases expected.[8] The implications for infrastructure are substantial: hardened communications networks, secure energy supply, resilient transport corridors, and cyber-capable digital infrastructure are all critical components of modern defence readiness. Much of this investment will be channelled through, or create demand for, listed infrastructure companies. What hasn't changed Infrastructure fundamentals have proven true to label Over the past decade, the global listed infrastructure universe has navigated some of the most severe macro shocks in living memory: a global pandemic, supply chain collapse, a surge in inflation not seen since the 1980s, a European land war, and an energy crisis that redrew assumptions about how the world powers itself. Through all of it, infrastructure earnings have done what the asset class promised: they have held up. That resilience reflects the structural characteristics that define infrastructure: long-duration contracted or regulated earnings streams, essential service monopolies, and pricing mechanisms with inflation linkage. More importantly, over the last decade the annualised earnings CAGR of the listed infrastructure universe has significantly exceeded that of general equities - a record that speaks to the quality of the underlying cash flows, not simply market conditions. Yield has also been a consistent differentiator. In every year of the Fund's ten-year life, the income component of listed infrastructure has exceeded that of broad global equities.[9] Infrastructure is still not well understood as a standalone asset class The persistent perception of listed infrastructure as a 'bond proxy': reactive to interest rate movements and little else. This continues to understate the earnings dynamism, diversification benefits, and structural growth potential of the asset class. The reality is that infrastructure companies generate earnings growth through capital investment cycles, pricing power, and volume growth, not simply by the level of rates. That mischaracterisation has, if anything, created ongoing opportunities for active managers prepared to look through it. Allocations remain sub-optimal Despite the asset class's risk-adjusted return profile - delivering broadly comparable long-term returns to global equities with materially lower volatility and downside capture - institutional and retail allocations to listed infrastructure remain modest. Many global equity managers hold minimal infrastructure exposure, often concentrated in a small number of large-cap utility names. The diversification and income benefits of a dedicated, actively managed global infrastructure allocation continue to be under-utilised. The listed-versus-unlisted valuation gap persists Institutional capital continues to flow disproportionately to unlisted infrastructure, tolerating illiquidity premiums and elevated entry valuations. Listed infrastructure offers access to the same underlying asset with daily liquidity, lower transaction costs, and, at current valuations, what we consider a compelling relative entry point. As listed infrastructure fundamentals continue to prove themselves and the asset class benefits from increased institutional recognition, we believe this discount represents an embedded source of potential value for long-term listed infrastructure investors. A global portfolio must genuinely be global The temptation to treat 'global' infrastructure through a developed-market lens - principally North America and Western Europe - remains common. At 4D we have always believed, and our experience over ten years has reinforced, that a portfolio which ignores the scale, diversity, and growth potential of Asia, Latin America, and evolving emerging markets is accepting a significant constraint on both return potential and portfolio construction quality. Not just a defensive allocation -- a structural growth story Ten years ago the 4D Global Infrastructure Fund (Unhedged) launched with the conviction that a rigorously managed, genuinely global portfolio of listed infrastructure assets could deliver reliable, macro-aware returns through market cycles. A decade of annualised returns exceeding 10%, through some of the most challenging market conditions in modern history, has validated that conviction. What has changed is the scale of the opportunity. The energy transition, the digital economy, the reshoring of supply chains, the emerging middle class evolution, and decades of under-investment in developed markets have created a pipeline of infrastructure investment need that will define capital allocation for the next generation. What hasn't changed is our approach. Disciplined country and sector analysis. Integrated and rigorous bottom-up/top down stock selection. A focus on quality assets with superior management teams, visible earnings, genuine competitive moats, and appropriate valuations.
[2] GLIO (Global Listed Infrastructure Organisation), GLI101: Why Invest in GLI. [3] GLIO, GLI101: Why Invest in GLI. [4] Multiple sources. CreditSights (November 2025) projected aggregate capex for the five largest hyperscalers (Amazon, Alphabet, Microsoft, Meta, Oracle) at approximately USD 602 billion in 2026. Subsequent guidance from individual companies following Q4 2025 earnings calls suggests aggregate 2026 capex could exceed USD 650 billion. [5] International Energy Agency (IEA), Energy and AI Special Report, April 2025. [6] 'The Infrastructure Moment', September 2025. [7] IFM Investors, Infrastructure Horizons 2025 report. [8] European Commission, ReArm Europe / SAFE programme, 2025. Carnegie Endowment for International Peace, December 2025; European Commission, October 2025. commission.europa.eu [9] GLIO, GLI101: Why Invest in GLI. On average since 2003, global listed infrastructure has yielded approximately 3.6% versus 2.6% for global equities. glio.org Funds operated by this manager: 4D Global Infrastructure Fund (Unhedged) , 4D Global Infrastructure Fund (AUD Hedged)
|