NEWS

2 Feb 2026 - New Funds on Fundmonitors.com
|
New Funds on FundMonitors.com |
|
Below are some of the funds we've recently added to our database. Follow the links to view each fund's profile, where you'll have access to their offer documents, monthly reports, historical returns, performance analytics, rankings, research, platform availability, and news & insights. |
 |
||||||||||||||||||||||
| Blue Owl Credit Income Fund AUT - Class A | ||||||||||||||||||||||
|
||||||||||||||||||||||
| View Profile | ||||||||||||||||||||||
|
Orbis Global Equity LE Fund |
||||||||||||||||||||||
|
||||||||||||||||||||||
 |
||||||||||||||||||||||
| L1 Capital Gold Fund | ||||||||||||||||||||||
|
||||||||||||||||||||||
| View Profile | ||||||||||||||||||||||
|
Want to see more funds? |
||||||||||||||||||||||
|
Subscribe for full access to these funds and over 900 others |


29 Jan 2026 - Navigating EMD: risks, rewards and what's ahead
|
Navigating EMD: risks, rewards and what's ahead abrdn January 2026 (6-minute read) We've been investing in emerging market debt (EMD) for over 30 years, with deep experience across both fast-growing frontier markets and established economies - at the corporate and sovereign level. So, what are the opportunities, risks, innovations and trends in EMD investing today? Read our far-reaching interview with Siddharth Dahiya, Global Head of EMD, to find out. Q: Why should investors consider emerging market debt in 2026 and what are some of the most attractive opportunities?Emerging market debt (EMD) enters 2026 in great shape. Across the asset class, we're seeing a range of positive dynamics. Hard currency sovereigns, for example, are experiencing a wave of ratings upgrades, reversing a decade-long trend of downgrades. This shift signals improving fundamentals and growing resilience across many EM economies. Q: How do you expect the EMD landscape to evolve over the next 12 months?We see the this year as a period of steady momentum rather than dramatic change. What is catching our eye is the growing interest in local currency debt, especially in frontier markets that used to fly under the radar. Investors are starting to take notice, attracted by improving fundamentals and compelling yields in these markets. Q: Which frontier markets stand out as offering unique potential - and what are the risks?Frontier markets present a diverse set of opportunities, each with its own idiosyncratic stories. The risks here are less about broad macro shocks and more about country-specific factors. For example, some frontier economies are heavily reliant on oil exports, making them vulnerable to price swings. Q: Are there thematic strategies within EMD that investors should pay attention to?Several themes are shaping the EMD landscape. The distinction between oil exporters and importers remains important, as does the impact of global tariffs and the ongoing trend towards nearshoring. Q: How do you balance sovereign versus corporate EMD exposure in the current environment?We believe both sovereign and corporate EMD have important roles to play in a well-constructed portfolio. Sovereign debt offers a wider dispersion of ratings, providing access to higher-yielding opportunities, while corporate debt tends to be higher quality, with a greater proportion of investment-grade issuers. Q: What role does currency exposure play in EMD returns, and how do you manage FX risk?Currency moves are a key component of the EMD narrative, especially in local markets. Last year, FX appreciation against the dollar was a significant contributor to performance. Investors can benefit from both currency gains and yield compression in local markets. If the dollar continues to weaken, local currency EMD should remain attractive. Q: How do you see global monetary policy shifts - especially potential rate cuts - impacting EMD performance?Global rate cuts are good news for EMD. Lower risk-free rates enhance the appeal of higher-yielding markets like EM, encouraging investors to seek out additional carry. When US Treasuries offer lower yields, the incentive to allocate to EMD increases, driving inflows and supporting performance. Q: What catalysts could unlock value in EMD over the next year?There are many. Country-specific reforms, successful restructurings, and geopolitical developments could all move the needle. Increased investor attention and flows are also important. Despite EM accounting for around half of global growth, it remains a small portion of most portfolios. A secular shift towards greater EM allocations could unlock significant value for investors. Q: For investors considering EMD today, what allocation strategies make sense - active vs. passive, hard vs. local currency?Active management makes the most sense. The asset class is diverse and idiosyncratic, and evidence shows active managers consistently outperform passive approaches. In such a complex market, skilled security selection, risk assessment and country analysis add meaningful value that passive exposures simply can't replicate. The choice between hard and local currency depends on risk tolerance. Local currency offers greater potential but comes with higher volatility, while hard currency can provide defensive qualities, especially in investment-grade segments. |
|
Funds operated by this manager: abrdn Sustainable Asian Opportunities Fund , abrdn Emerging Markets Equity Fund , abrdn Sustainable International Equities Fund , abrdn Global Corporate Bond Fund (Class A) |

28 Jan 2026 - Trip Insights: Canada - US

21 Jan 2026 - Why collaborating is key to climate change
Why collaborating is key to climate changePendal January 2026 5 minutes read time |
|
WHAT does it take to tackle climate change, food security, or pandemic risk? At the recent PRI Stewardship and Collaboration Forum, the answer was clear: collective action. The United Nations Principles for Responsible Investment (UNPRI) brought together global leaders in sustainable finance. This Sydney forum, hosted by Regnan, convened 45 asset owners, managers, and responsible investment professionals to share insights on collaborative stewardship. Regnan's Grace Zhang presented at a similar event in Melbourne. The power of collective actionInvestors face challenges that are global and demand collective action. Issues such as climate change are beyond the control of one individual company or investor. Investors who view their activities within the context of interconnected, dynamic systems recognise their role in building resilience across the financial ecosystem. This systems-thinking approach has long been central to Regnan's research, engagement, and advocacy. It is why Regnan is actively involved in industry associations and initiatives within the responsible investment industry. Why impact investing? Aligning investments with personal values to have a positive impact on the world while also generating a financial return. Why collaboration mattersCollaboration gives investors access to diverse perspectives, shared intelligence and optimises resources. It also offers greater scale. Regnan has long recognised the importance of bringing voices together to address big challenges. Since Regnan became part of the Perpetual Group, stewardship opportunities have been amplified. This represents greater funds under management (FUM), which has increased influence. Collaboration also enables different engagements across geographies, asset classes and fund types. We have found within the Perpetual Group that collaboration allows for diversity of thought through challenging assumptions and improving decision quality. Regnan research highlights that to achieve true diversity is not just by having varied backgrounds, but by also cultivating a culture where differences can be valued and expressed. Regnan also seeks to bring voices together across our industry. This has included hosting like with the PRI event earlier this month, as well as facilitating and bringing communities together. A few years ago, Regnan brought together different links along the food production supply chain to discuss sustainable agriculture. Last month, we walked around the Regnan eucalyptus trees we get our name from with key leaders in the biodiversity space for an exploration of the work Regnan is doing in advocating the Great Forest National Park. Regnan is also a supporter of the other initiatives by the UNPRI, working with the SPRING initiative which relates to nature, co-leads the Collaborative Sovereign Engagement on Climate, and has a longstanding membership with the Climate Action 100+ initiative. Challenges and realitiesPositive intentions alone do not guarantee smooth collaboration. As anyone who participated in group projects at university knows, not all contributions are equal. Internal alignment with specific funds, mandates, and client expectations are essential. Collaboration must connect with other stewardship and engagement efforts to avoid "collaborative fatigue" - multiple meetings with nebulous outcomes that fail to advance the purpose of the funds. Why now? Continued ramp up in focus on climate change and ways to achieve global net zero goals through the transition to clean energy is generating greater opportunities and diversification in impact investing. Navigating regulationRegulatory challenges are increasingly shaping the landscape of responsible investment. In the US, political resistance has led to changes in shareholder rights, antitrust claims, and investigations into proxy advisors. Closer to home, the ACCC has opened consultations to introduce a class exemption for certain types of beneficial collaboration. It is vital that joint stewardship activities, such as engagement on climate, human rights, and governance, remain permissible under competition law. Restricting such collaboration could undermine efforts to address systemic ESG risks that require collective action. Looking forwardCollaboration does not negate competitive tension. Our clients expect us to undertake stewardship activities that provide meaningful investment insights and strengthen portfolio holdings. Nevertheless, collaborative stewardship is essential for managing systemic risk. Regnan has been a pioneer in using a systems-thinking approach to sustainable investing, and involvement in these collective initiatives is vital to support the health and resilience of the entire system (which, incidentally, includes our investable universe). The stewardship work Regnan does for Regnan funds, and the support provided across the Perpetual boutiques, treats stewardship as a beneficial component to active management. Leadership in collaboration activities allows us to leverage our research and experience, ultimately making us better stewards of the portfolios we influence. Why Regnan Credit Impact Trust? Provides easy access to an institutional-grade impact investment fund that is highly liquid, diversified and scalable. |
|
Funds operated by this manager: Pendal MicroCap Opportunities Fund , Pendal Global Select Fund - Class R , Pendal Sustainable Australian Fixed Interest Fund - Class R , Pendal Focus Australian Share Fund , Pendal Horizon Sustainable Australian Share Fund , Regnan Credit Impact Trust Fund , Pendal Sustainable Australian Share Fund , Pendal Sustainable Balanced Fund - Class R , Pendal Multi-Asset Target Return Fund |
|
This information has been prepared by Pendal Fund Services Limited (PFSL) ABN 13 161 249 332, AFSL No 431426 and is current as at December 8, 2021. PFSL is the responsible entity and issuer of units in the Pendal Multi-Asset Target Return Fund (Fund) ARSN: 623 987 968. A product disclosure statement (PDS) is available for the Fund and can be obtained by calling 1300 346 821 or visiting www.pendalgroup.com. The Target Market Determination (TMD) for the Fund is available at www.pendalgroup.com/ddo. You should obtain and consider the PDS and the TMD before deciding whether to acquire, continue to hold or dispose of units in the Fund. An investment in the Fund or any of the funds referred to in this web page is subject to investment risk, including possible delays in repayment of withdrawal proceeds and loss of income and principal invested. This information is for general purposes only, should not be considered as a comprehensive statement on any matter and should not be relied upon as such. It has been prepared without taking into account any recipient's personal objectives, financial situation or needs. Because of this, recipients should, before acting on this information, consider its appropriateness having regard to their individual objectives, financial situation and needs. This information is not to be regarded as a securities recommendation. The information may contain material provided by third parties, is given in good faith and has been derived from sources believed to be accurate as at its issue date. While such material is published with necessary permission, and while all reasonable care has been taken to ensure that the information is complete and correct, to the maximum extent permitted by law neither PFSL nor any company in the Pendal group accepts any responsibility or liability for the accuracy or completeness of this information. Performance figures are calculated in accordance with the Financial Services Council (FSC) standards. Performance data (post-fee) assumes reinvestment of distributions and is calculated using exit prices, net of management costs. Performance data (pre-fee) is calculated by adding back management costs to the post-fee performance. Past performance is not a reliable indicator of future performance. Any projections are predictive only and should not be relied upon when making an investment decision or recommendation. Whilst we have used every effort to ensure that the assumptions on which the projections are based are reasonable, the projections may be based on incorrect assumptions or may not take into account known or unknown risks and uncertainties. The actual results may differ materially from these projections. For more information, please call Customer Relations on 1300 346 821 8am to 6pm (Sydney time) or visit our website www.pendalgroup.com |

19 Jan 2026 - 10k Words | January 2026
|
10k Words Equitable Investors January 2026 (2-minute read) We kick off calendar 2026 by trying our hand at our own sentiment indicators - combining valuation and implied volatility for the US equity and bond markets, the Aus equity market and ASX small caps. Are investors paying a premium price for market calmness? Then we check in on Morningstar's bottom-up valuations. There is a chasm between small and large cap valuations based on revenue multiples but not so much on earnings. Tech has done the heavy lifting in large cap valuation AND earnings in the US over the past decade and the trend is expected to continue - but can US smalls deliver on lofty targets and drive a catch-up? In US dollars, the US market has underperformed most major markets in the Americas. Then we look at how short-term (daily) volatility itself is becoming more volatile over time. Turning to the economy, we look at personal loan delinquencies and savings rates, with signs of deterioration in consumer behaviour. A custom US equity market sentiment score - based on CAPE adjusted equity risk premium and the VIX relative to their historical average and volatility 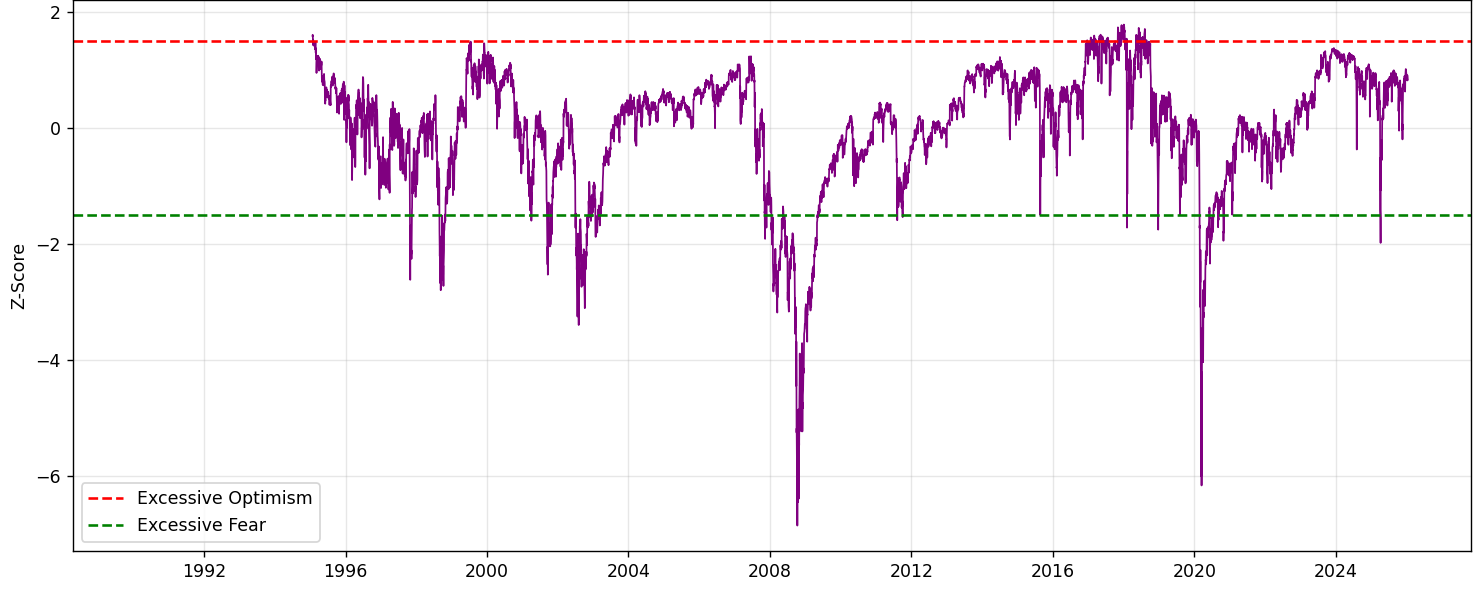
Source: Equitable Investors A custom ASX equity market sentiment score - based on the dividend yield spread on bonds and the ASX VIX relative to their historical average and volatility 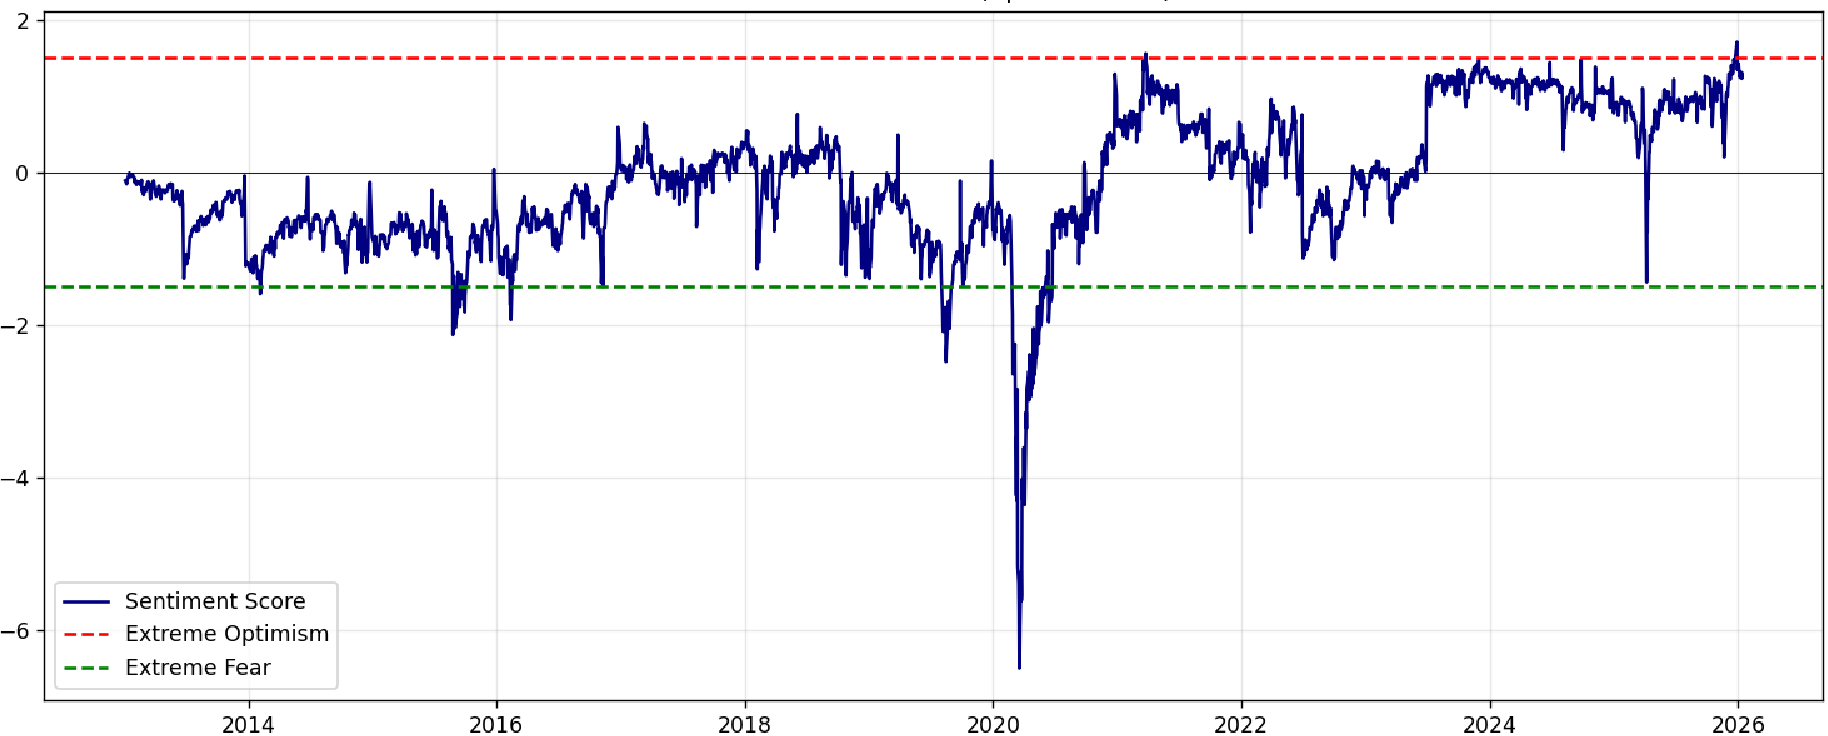
Source: Equitable Investors A custom ASX small cap sentiment score - based on the dividend yield spread on bonds and realised volatilty relative to their historical average and volatility 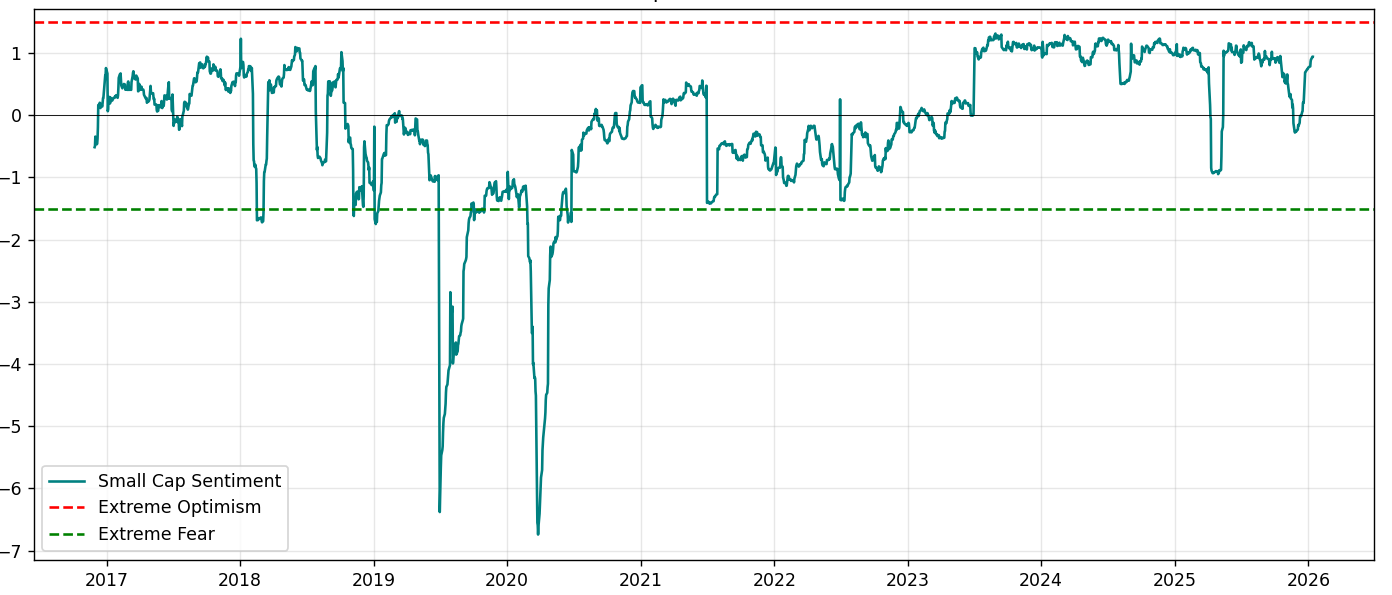
Source: Equitable Investors A custom US debt market sentiment score - based on 10 year bond yield and MOVE Index of implied volatility relative to their historical average and volatility 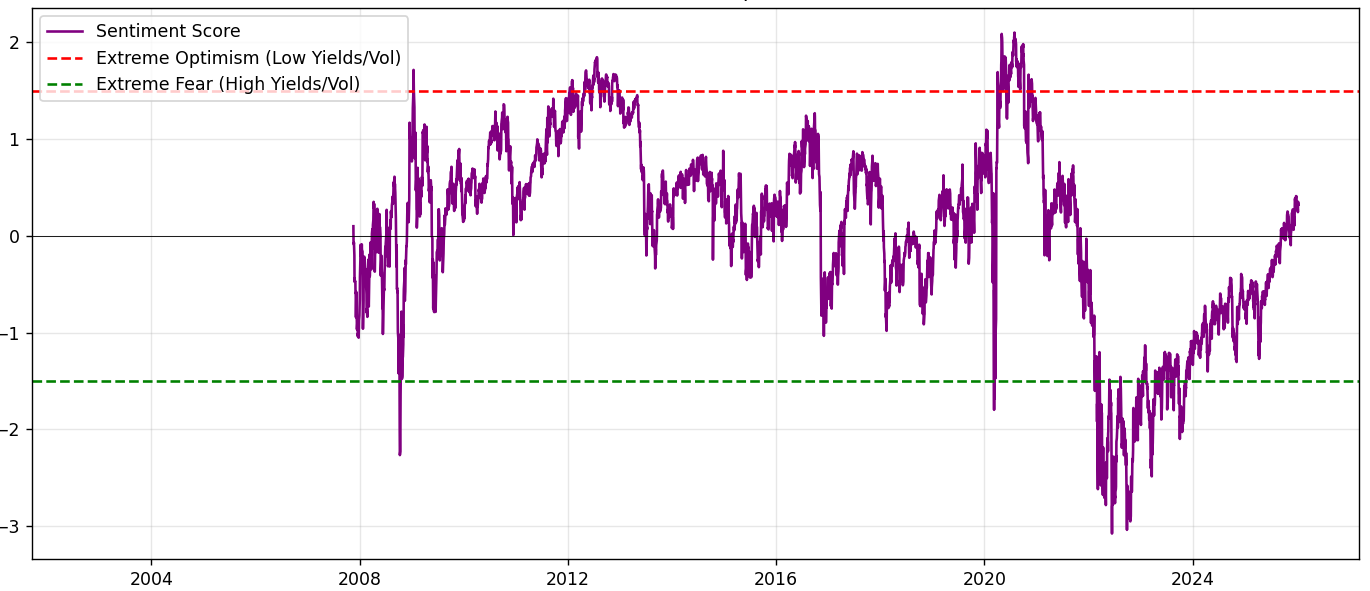
Source: Equitable Investors Market price relative to US market bottom-up valuations from Morningstar 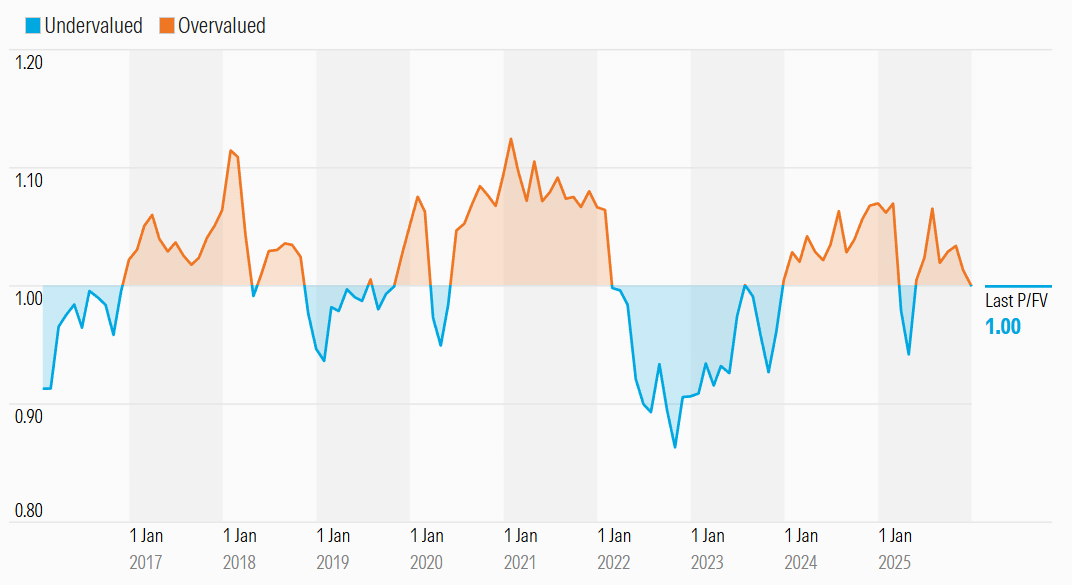
Source: Morningstar Market price relative to ASX market bottom-up valuations from Morningstar 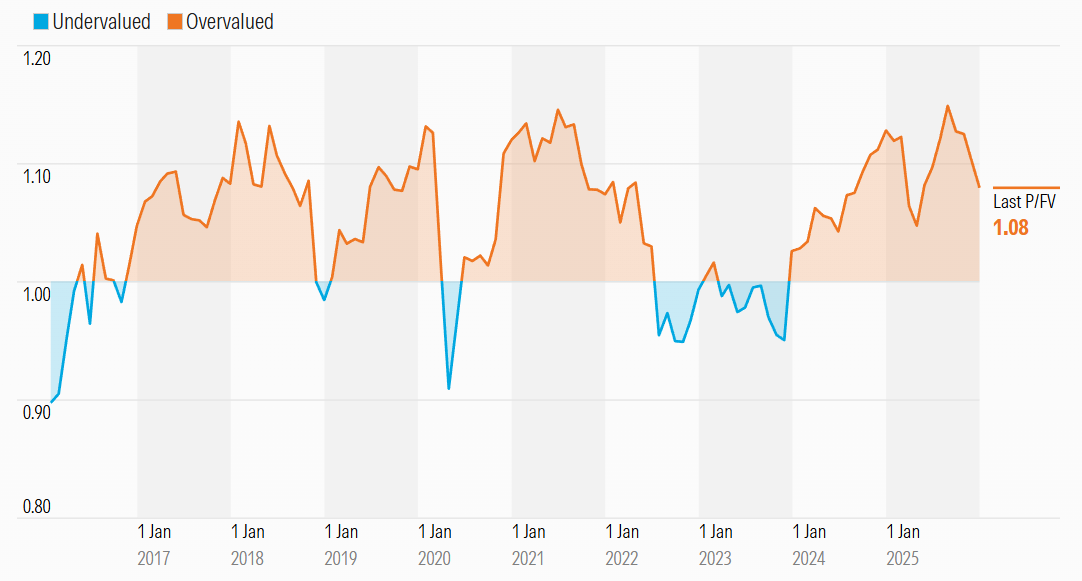
Source: Morningstar Earnings: US Tech vs the Rest 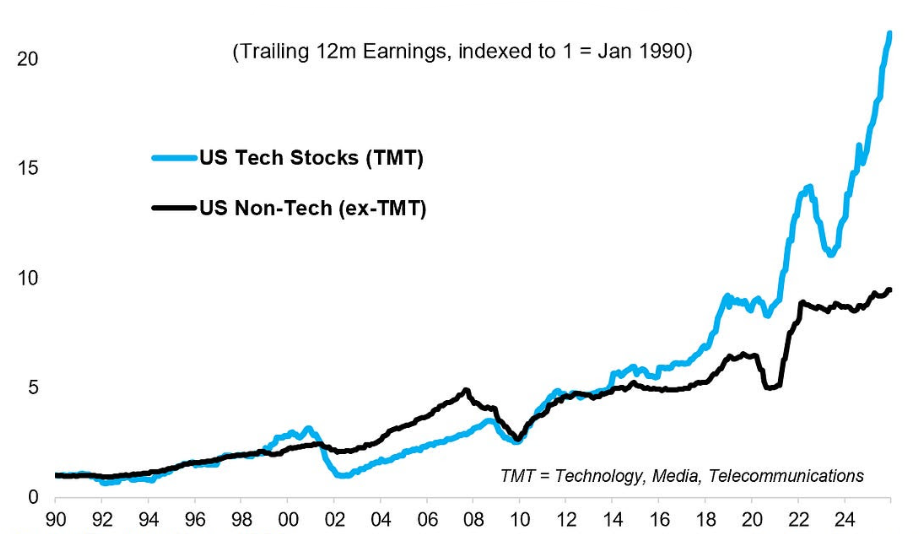
Source: Topdown Charts Actual reported and bottom-up consensus EPS growth estimates 
Source: Goldman Sachs Global Investment Research Enterprise Value / consensus sales - S&P 500 (IVV ETF) v US microcaps (IWM ETF) 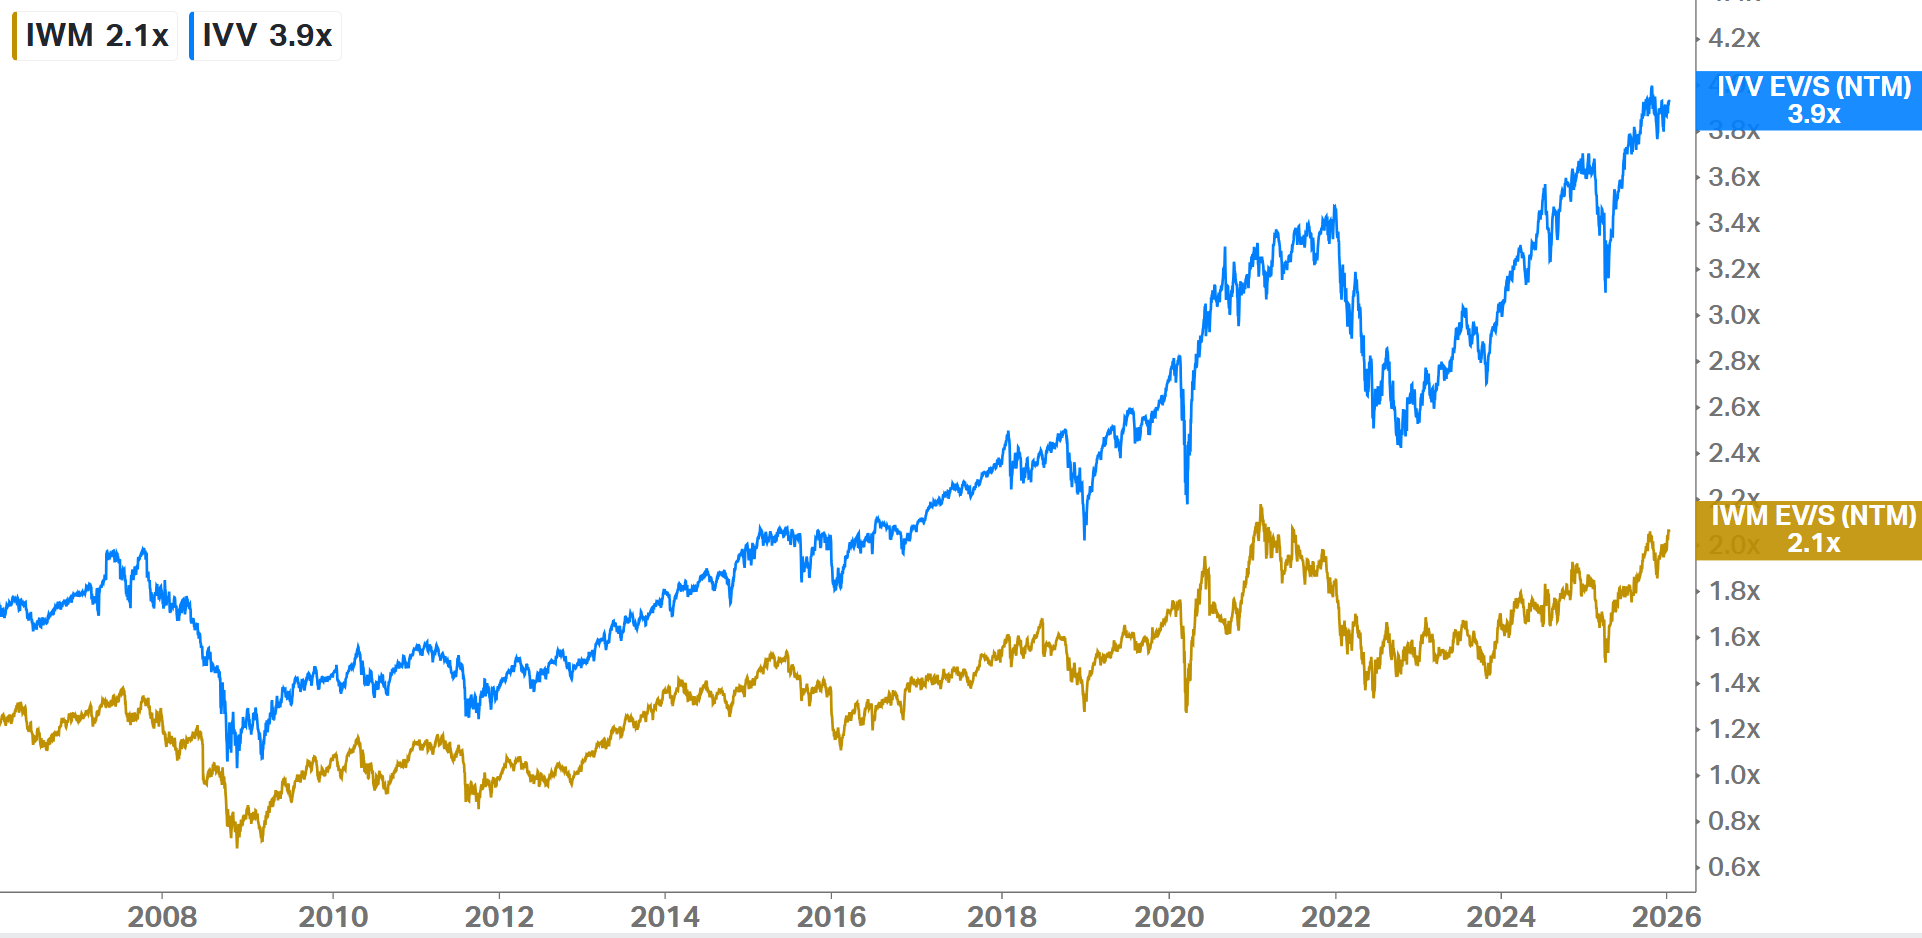
Source: Koyfin Enterprise Value / consenus EBITDA - S&P 500 (IVV ETF) v US microcaps (IWM ETF) 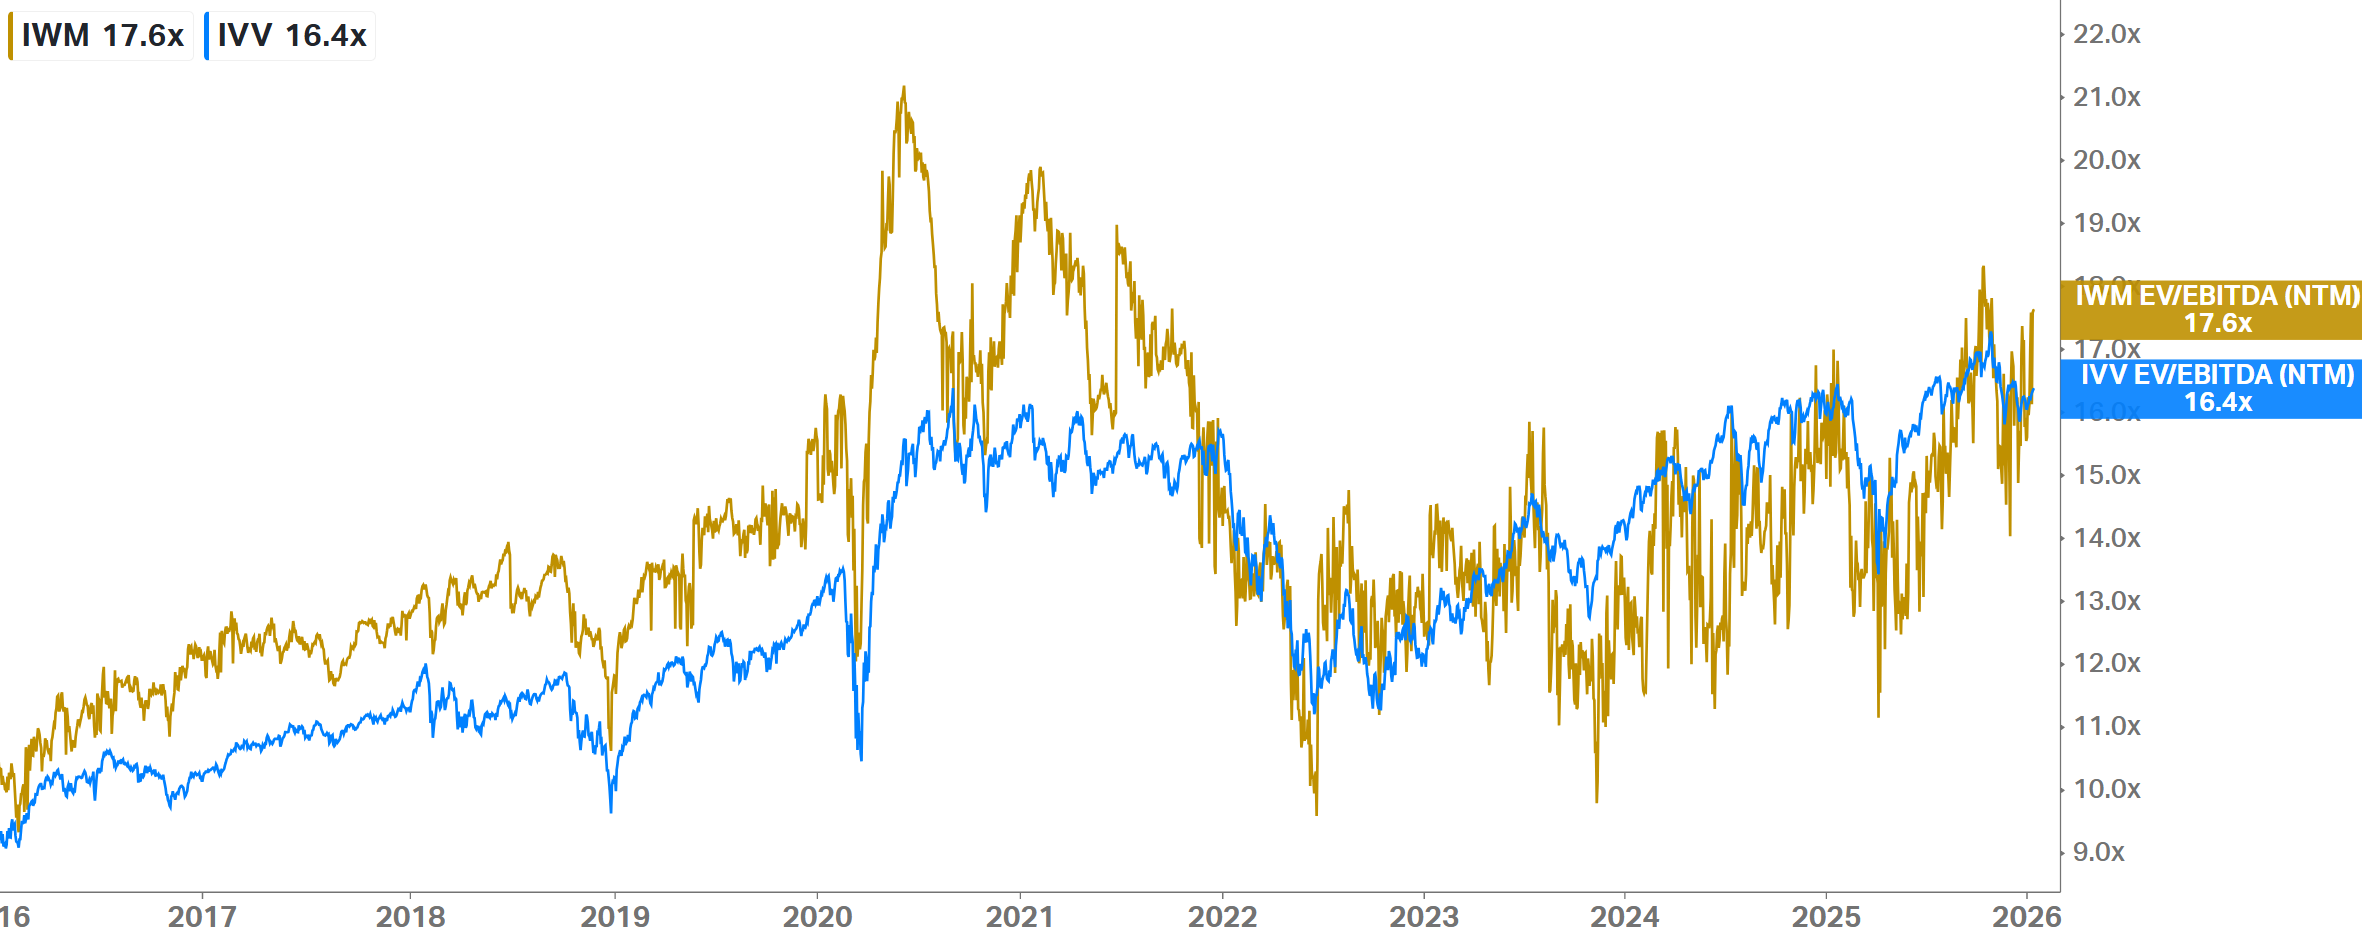
Source: Koyfin Price / consenus EPS - S&P 500 (IVV ETF) v US microcaps (IWM ETF) 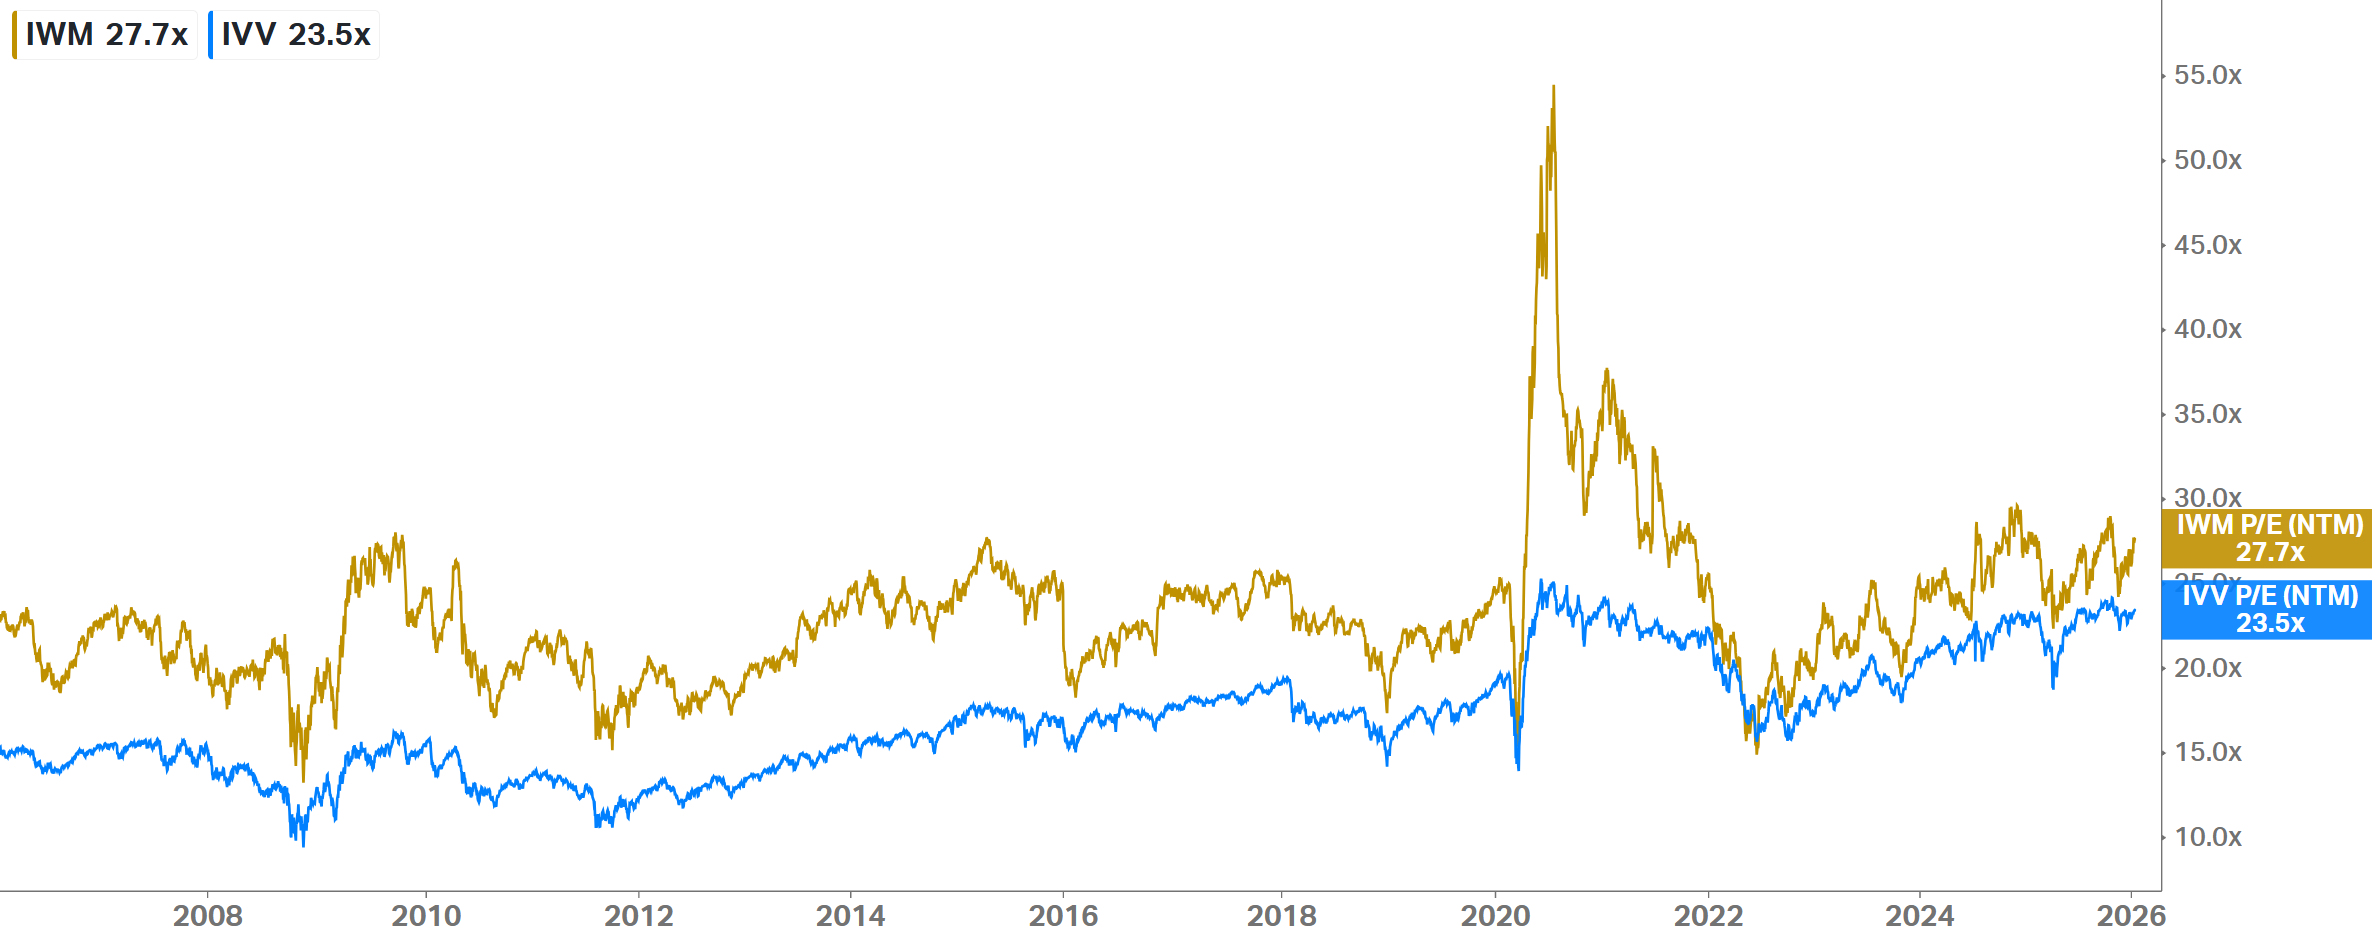
Source: Koyfin Country ETF performance over past 12 months (in USD) 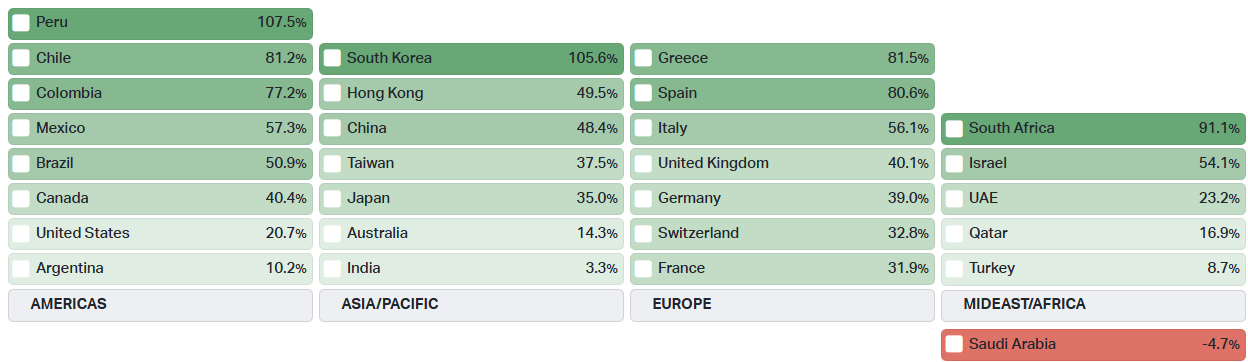
Source: Koyfin No. of daily 10% swings per calendar year in the VIX (CBOE Market Volatility) 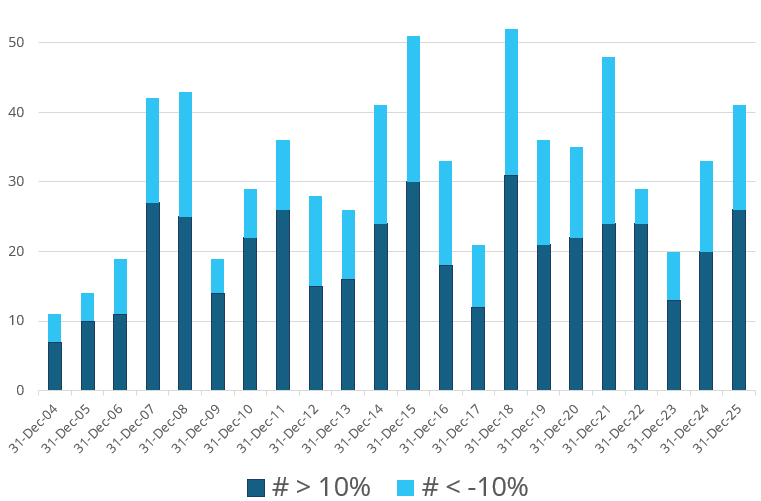
Source: Iress, Equitable Investors No. of daily 10% swings per calendar year in the S&P/ASX VIX 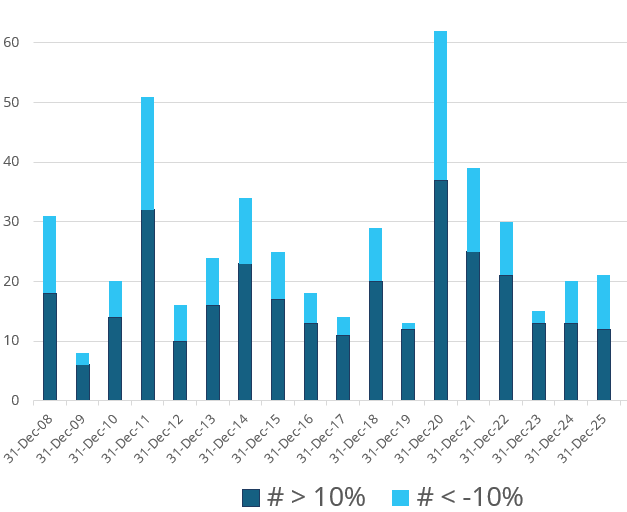
Source: Iress, Equitable Investors Personal Loans - 90+ Delinquency (#) 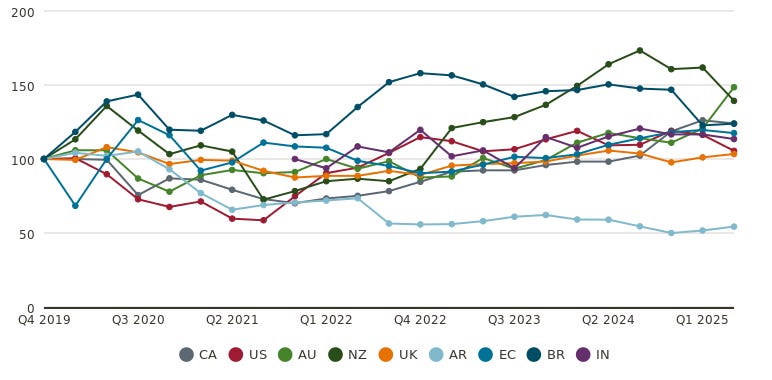
Source: Equifax Australian savings ratio 
Source: RBA USA personal saving 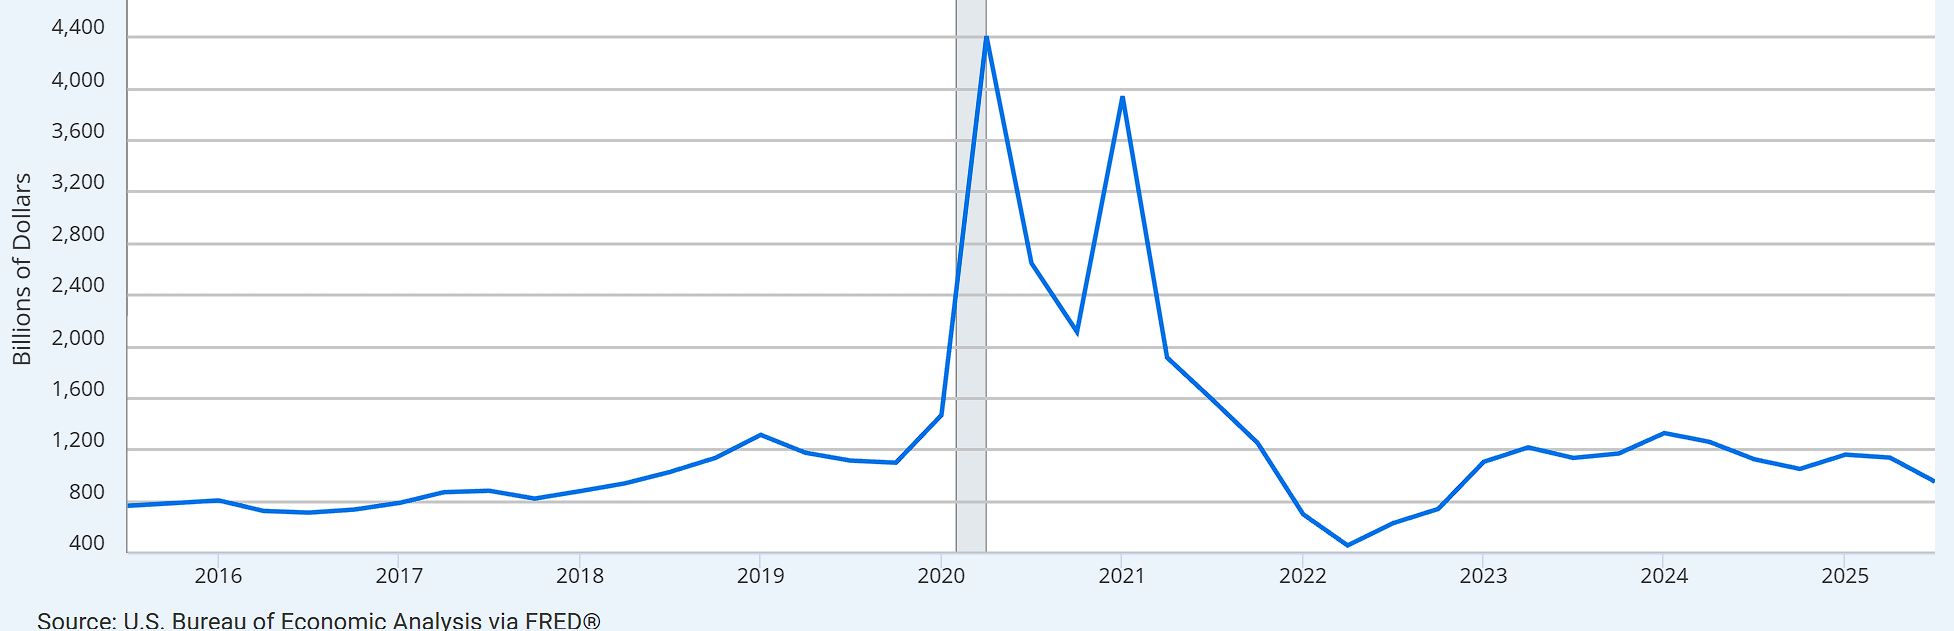
Source: St Louis Fed Funds operated by this manager: Equitable Investors Dragonfly Fund Disclaimer Past performance is not a reliable indicator of future performance. Fund returns are quoted net of all fees, expenses and accrued performance fees. Delivery of this report to a recipient should not be relied on as a representation that there has been no change since the preparation date in the affairs or financial condition of the Fund or the Trustee; or that the information contained in this report remains accurate or complete at any time after the preparation date. Equitable Investors Pty Ltd (EI) does not guarantee or make any representation or warranty as to the accuracy or completeness of the information in this report. To the extent permitted by law, EI disclaims all liability that may otherwise arise due to any information in this report being inaccurate or information being omitted. This report does not take into account the particular investment objectives, financial situation and needs of potential investors. Before making a decision to invest in the Fund the recipient should obtain professional advice. This report does not purport to contain all the information that the recipient may require to evaluate a possible investment in the Fund. The recipient should conduct their own independent analysis of the Fund and refer to the current Information Memorandum, which is available from EI. |
14 Jan 2026 - Private markets outlook 2026: navigating opportunities through structural change
|
Private markets outlook 2026: navigating opportunities through structural change abrdn January 2026 (4-minute read) Private markets should enter 2026 with a renewed sense of purpose. After a period of volatility and recalibration, the landscape has shifted in favour of long-term investors seeking resilience, diversification, and access to secular growth themes. From the growing role of private credit in corporate finance to the acceleration of digital and green infrastructure, the past year has underscored the strategic importance of private assets in modern portfolios. The macroeconomic backdrop is evolving. Global growth has slowed but remains intact, and inflationary pressures are beginning to ease. Central banks are approaching the end of their tightening cycles, with some already pivoting towards more accommodative stances. This shift in monetary policy is improving financing conditions, and supporting deal activity and valuations across private markets. Against this backdrop, our latest Private Markets House View outlines a cautiously optimistic outlook across the four major asset classes: private equity, private credit, infrastructure, and real estate. Each offers distinct opportunities, shaped by structural trends and regional dynamics. Private equity: rebound and realignmentPrivate equity has staged a strong recovery, with deal-making regaining momentum as confidence returns to the market. Improved credit availability and greater alignment between buyers and sellers have helped restore activity levels. Valuations, which had softened during the previous downturn, have rebounded, reflecting both stronger financing conditions and a focus on higher-quality assets. Thematic investing remains central to private equity strategies. Technology and healthcare continue to attract capital, driven by innovation and demographic shifts. Businesses that harness digital tools, automation, and artificial intelligence are particularly appealing. Meanwhile, sectors more exposed to economic cycles are being approached with greater caution, as investors prioritise resilience and long-term growth potential. Looking ahead, private equity is expected to maintain its role as a key driver of portfolio returns. While macroeconomic risks persist, the combination of structural tailwinds and a disciplined investment approach positions the asset class well for the coming years. Private credit: filling the lending gapPrivate credit has cemented its place as a vital source of capital, particularly as traditional banks scale back lending. In some regions, deal activity has been more subdued, reflecting recent market volatility and policy uncertainty. However, the underlying demand for private credit remains robust, with investors drawn to its income-generating potential. In Europe, direct lending has been especially active. It is supported by structural trends, such as bank disintermediation and the continued appetite for flexible financing solutions. Lenders are focusing on smaller, mid-market transactions where pricing and terms remain attractive. Credit quality has held up well, with lenders adopting more conservative structures to mitigate downside risk. As interest rates stabilise, the appeal of floating-rate instruments and the potential for enhanced yields continue to attract capital. Private credit opportunities are emerging in both traditional lending and more opportunistic strategies. Infrastructure: investing in the futureInfrastructure investment is thriving, fuelled by the global push towards digitalisation and decarbonisation. Capital deployment has accelerated, with strong interest in sectors such as renewable energy and digital infrastructure. These areas are benefiting from long-term policy support and growing demand for sustainable and connected solutions. Investors are increasingly looking beyond traditional core assets, seeking exposure to opportunities that offer a blend of stability and growth. Core-plus strategies, which involve assets with modest development or operational risk, are gaining traction as they offer the potential for higher returns without sacrificing predictability. The pipeline for infrastructure projects remains healthy, supported by public and private sector initiatives. As the energy transition gathers pace and digital connectivity becomes ever-more critical, infrastructure is set to remain a cornerstone of private market allocations. Real estate: a market in transitionPrivate real estate is showing signs of stabilisation following a period of adjustment. The easing of monetary policy is beginning to support valuations, and certain regions are experiencing a modest recovery. However, performance remains uneven, with outcomes varying significantly by geography and sector. A clear polarisation is emerging within the asset class. Investors are gravitating towards high-quality, future-fit assets that align with long-term trends. Logistics and residential properties are in favour, driven by structural demand and limited supply. In contrast, traditional office and retail assets face ongoing challenges, with changing work patterns and consumer behaviour reshaping demand. The focus is increasingly on assets that offer sustainability credentials, adaptability, and strong tenant demand. Value-add strategies, which involve repositioning or upgrading properties, are also gaining interest as investors seek to unlock value in a shifting landscape. Final thoughts...As we look to the year ahead, private markets offer a compelling proposition. Each asset class presents unique opportunities, underpinned by structural change and evolving investor needs. While selectivity and discipline remain essential, with improving macro conditions, private markets will continue to be a key driver of portfolio diversification and resilience. Private markets have become a vital component of investors' asset allocation. By embracing innovation, sustainability, and long-term thinking, investors can position themselves to navigate uncertainty and capture the opportunities that lie ahead in 2026 and beyond. |
|
Funds operated by this manager: abrdn Sustainable Asian Opportunities Fund , abrdn Emerging Markets Equity Fund , abrdn Sustainable International Equities Fund , abrdn Global Corporate Bond Fund (Class A) |

13 Jan 2026 - Affordability is a hot button issue for 2026

12 Jan 2026 - Investment Perspectives: Thinking about A-REITS

19 Dec 2025 - Capitalizing on volatility in sustainable equities - a strategic approach to uncertainty
|
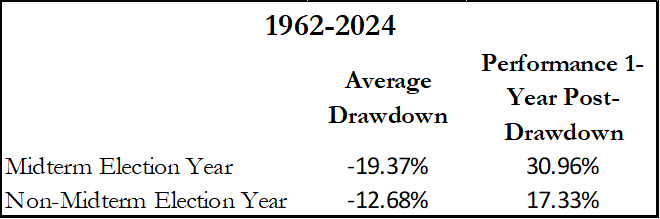
Capitalizing on volatility in sustainable equities - a strategic approach to uncertainty Janus Henderson Investors December 2025 (7-minute read) While we apply a bottom-up stock picking process it is important to have a macro view overlay to guide us on portfolio construction. The rate of change, whether it is societal, geopolitical, or technological continues to increase exponentially and this argues for active management over passive. There are three key macro topics that we are watching particularly closely as we move towards 2026. The first is everyone's favorite topic of artificial intelligence (AI). The second is the overall health of the economy and what we expect to see from the Trump administration. And last but not least is private credit. Why AI is not a bubbleFirst on AI, no, it is not a bubble. Yes, there will be some misallocation of capital and an ensuing market downturn sometime in the next five years just as we have seen with every new technology going back hundreds of years. We acknowledge the non-zero probability that large language models (LLMs) prove to be a dead end to true artificial general intelligence (AGI); however, we are also comforted by our meetings with companies that are citing use cases that are already driving significant costs savings. We do not think AI is currently in a bubble, because ultimately it comes down to supply and demand. Unlike the commercial internet where you just dug a hole and laid some fiber, AI compute is infinitely more physically challenging to incrementally produce. To provide perspective, to produce a one-gigawatt (GW) data center that will run LLMs, it requires six football fields of land along with over 200,000 tons of equipment such as cables, heating, ventilation and air conditioning (HVAC), transformers, etc.1 There are legitimate questions around if we even have enough electricity and skilled tradespeople to address a fraction of the tens of GWs of data centers that have been announced. On the demand side, anecdotes suggest a waiting list of 20 different customers for each newly installed Nvidia graphics processing unit (GPU) at a data center. We will continue to pay close attention to companies addressing key bottlenecks (such as Nvidia, Prysmian, Schneider, ) that are acting as a governor on the adoption of AI. Further, we will continue to remain vigilant to AI exposed companies where valuations may be implying too optimistic of a scenario while also taking advantage of any irrational selloffs in AI exposed names. We feel that we are still early in the AI capital expenditure (capex) cycle and there is still significant outperformance to be had by investing in this space. Running the economy hot: fiscal and monetary support aheadOn the topic of the U.S. and global economy, while there are certainly some wobbles in the consumer spending and confidence (particularly the bottom 80%) we expect significant fiscal and monetary support taking hold over the next five months. Indications are that Trump is going to run the economy hot through the mid-term election a year from now. We should expect significant tax refunds both for individuals and corporations in the first few months of next year due to the One Big Beautiful Bill (OBBB). We should also expect other initiatives from the Trump administration focused on bringing down costs in housing and healthcare along with the possibility of some form of helicopter money (US$2,000 has been floated as a giveaway to those making US$100,000 or less). Finally, we expect the U.S. Federal Reserve and U.S. Treasury to work in coordination and independently in bringing down interest rates and Treasury bill price volatility. All of this should be supportive of the economy and asset prices. For the stock market, in the short term, liquidity is one of the biggest drivers of performance and we should expect other countries to get involved as well. We are starting to see signs that China will implement further initiatives to support the local property market while Japan is proposing the most Federal spending since the pandemic. All of this is probably inflationary and one of the best defenses is to own finite assets like equities. We have a bias toward investing in companies that help to drive efficiencies in society and are thus deflationary. In our view, these companies should do well in an inflationary environment. With all of that said, next year is a mid-term election year which has historically brought about greater equity market volatility. The average peak-to-trough decline within the S&P 500 during an election year has been almost 20% going back to 1962. The good news is that these declines represent great buying opportunities as the 1-year return following these market troughs has averaged 31%. We again look forward to taking advantage of this volatility. Exhibit 1: S&P 500 price return 12-month period following a mid-term election
Source: Strategas, as at 25 November 2025. Why we're steering clear of leverage in an uncertain credit landscapeRegarding the last topic of private credit, this may not be a story specific to 2026, but it is worth noting given the events around the First Brands and TriColor scandals this year. Having gone through a couple of credit cycles in our careers, we have started to get a sense of déjà vu. What is different this time is that it appears that more of the risk has moved to cashflow-driven direct lending private credit and away from the banks (although banks may not be immune as roughly 10% of their U.S. loans are now to non-bank financial institutions). Unfortunately, given not all private credit is transparent, this means that the market will have much less early warning if something is wrong. Private credit is of course not all created equal. Some private credit and private equity houses have historically boasted about their high sharpe ratios and low volatility in underlying asset prices. But in certain instances, this was a function of and not having to worry about marked-to-market valuations. Some private credit houses have also enlisted other questionable strategies such as payment in kind (PIK) and maturity extensions. Banks have never had that privilege and thus we started to see warning signs on credit in 2006 and 2007. What we find concerning in pockets of private credit, along with the above tactics, is the potential conflict of interest as it is estimated that between 70% and 80% private credit loans have the same private equity sponsor. We are starting to see credit risk increase with a recent example of Renovo, a private equity backed home improvement contractor that went bankrupt and reported only US$50,000 in assets versus US$150 million in private credit loans. In 2026 there will be a need to look beneath the bonnet at the robustness of private credit processes, particularly in the diverse direct lending arena. In a scenario where there is a downturn in credit, investors will be well served by avoiding excessive balance sheet leverage and owning companies with mission critical products and services that tend to be more immune to economic downturns. Conclusion: Be prepared to benefit from disruptionIn an environment defined by accelerating change and heightened uncertainty, we believe there will be a clear need for disciplined bottom-up stock selection, combined with a thoughtful macro-overlay. This should be focused on identifying companies that are both resilient and aligned with long-term structural trends. By actively navigating opportunities in AI, remaining vigilant on economic policy shifts, and avoiding any hidden risks in private credit, our aim will be to capitalize on volatility rather than be constrained by it. History shows that periods of disruption create some of the most compelling investment opportunities - and investors should be prepared to seize them. |
|
Funds operated by this manager: Janus Henderson Australian Fixed Interest Fund , Janus Henderson Conservative Fixed Interest Fund , Janus Henderson Diversified Credit Fund , Janus Henderson Global Natural Resources Fund , Janus Henderson Tactical Income Fund , Janus Henderson Australian Fixed Interest Fund - Institutional , Janus Henderson Conservative Fixed Interest Fund - Institutional , Janus Henderson Cash Fund - Institutional , Janus Henderson Global Multi-Strategy Fund , Janus Henderson Global Sustainable Equity Fund , Janus Henderson Sustainable Credit Fund Disclaimer: This article reflects the views of the author(s) at the date of publication and does not necessarily represent those of FundMonitors.com. It is provided for general information only and does not constitute investment advice or a recommendation to buy or sell any security. Market data, views, and forward-looking statements were current as at 1 October 2025 and may change without notice. Past performance is not indicative of future results. Readers should consider their own objectives and obtain professional advice before making investment decisions. 1Citrini, 'Stargate: A Citrini Field Trip', (7 November 2025). Active investing: An investment management approach where a fund manager actively aims to outperform or beat a specific index or benchmark through research, analysis, and the investment choices they make. The opposite of passive investing. Artificial General Intelligence (AGI): A form of AI with the ability to understand, learn, and apply knowledge in a way that is indistinguishable from a human. Artificial Intelligence (AI): The simulation of human intelligence in machines that are programmed to think and learn. Balance sheet leverage: The use of borrowed funds in addition to equity to finance the purchase of assets. Bottom-Up stock picking: An investment strategy that focuses on analyzing individual stocks and their fundamentals rather than considering broader economic or market factors. Capital expenditure: Money invested to acquire or upgrade fixed assets such as buildings, machinery, equipment, or vehicles in order to maintain or improve operations and foster future growth. Helicopter money: A type of monetary policy that involves printing large sums of money and distributing it to the public to stimulate the economy. Inflation: The rate at which the prices of goods and services are rising in an economy. The consumer price index (CPI) and retail price index (RPI) are two common measures; the opposite of deflation. Large Language Models (LLMs): A type of AI model that is trained to understand and generate human language text. Liquidity/Liquid assets: Liquidity is a measure of how easily an asset can be bought or sold in the market. Assets that can be easily traded in the market in high volumes (without causing a major price move) are referred to as 'liquid'. Midterm Election: An election that occurs in the middle of a president's term, often leading to changes in the composition of Congress. The One Big Beautiful Bill (OBBB) is a major U.S. federal statute enacted on 4 July 2025. The bill represents the centerpiece of President Donald Trump's second-term legislative agenda and includes sweeping changes across tax policy, social programs, and federal spending priorities. Passive investing: An investment approach that involves tracking a particular market or index. It is called passive because it seeks to mirror an index, either fully or partially replicating it, rather than actively picking or choosing stocks to hold. The primary benefit of passive investing is exposure to a particular market with generally lower fees than you might find on an actively-managed fund, the opposite of active investing. Payment in Kind (PIK): A type of financing where interest payments are made in the form of additional debt rather than cash. Pretend and Extend: A strategy used in credit markets where lenders extend the terms of a loan to delay recognising a problem loan as non-performing. Private credit: Non-bank lending provided by private institutions, often involving loans to small and medium-sized businesses. Sharpe ratio: This measures a portfolio's risk-adjusted performance for the purpose of measuring how far a portfolio's return can be attributed to fund manager skill as opposed to excessive risk taking. A high Sharpe ratio indicates a better risk-adjusted return. Treasuries/US Treasury securities: Debt obligations issued by the US government. With government bonds, the investor is a creditor of the government. Treasury bills and US government bonds are guaranteed by the full faith and credit of the US government. They are generally considered to be free of credit risk and typically carry lower yields than other securities. Valuation metrics: Metrics used to gauge a company's performance, financial health, and expectations for future earnings, e.g. P/E ratio and ROE. Volatility: The rate and extent at which the price of a portfolio, security, or index, moves up and down. If the price swings up and down with large movements, it has high volatility. If the price moves more slowly and to a lesser extent, it has lower volatility. The higher the volatility, the higher the risk of the investment. All opinions and estimates in this information are subject to change without notice and are the views of the author at the time of publication. Janus Henderson is not under any obligation to update this information to the extent that it is or becomes out of date or incorrect. The information herein shall not in any way constitute advice or an invitation to invest. It is solely for information purposes and subject to change without notice. This information does not purport to be a comprehensive statement or description of any markets or securities referred to within. Any references to individual securities do not constitute a securities recommendation. Past performance is not indicative of future performance. The value of an investment and the income from it can fall as well as rise and you may not get back the amount originally invested. Whilst Janus Henderson believe that the information is correct at the date of publication, no warranty or representation is given to this effect and no responsibility can be accepted by Janus Henderson to any end users for any action taken on the basis of this information. |